
MatLab Simulink Like Source Code Solution
UCanCode, which has been rooted in the open source infrastructure of industrial software for more than 20 years, has always been one of the top professional providers of industrial software abroad. Many software companies around the world are built their high-quality products on this basis. Here we also hope to discuss the source code architecture of domestically produced Simulink instead of MatLab. It can be regarded as doing our part for software industry.
The design goal of UCanCode Simulink source code solution is to provide a comprehensive solution for domestic replacement of MatLab Simulink simulation, including:
One. Basic functions:
1. Algorithm block editing and definition.
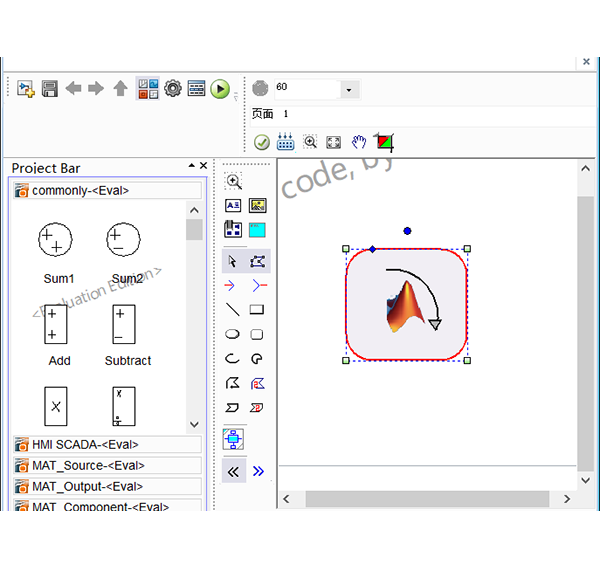
The drawing of the algorithm block can be drawn by UCanCode professional drawing tools, as shown in the figure below:
2. Define the interface:
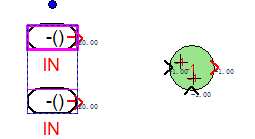
The number of input ports and output ports can be customized according to the needs of the algorithm block. For example, if we want to calculate the sum of two numbers, then define two input ports and one output port, as follows:
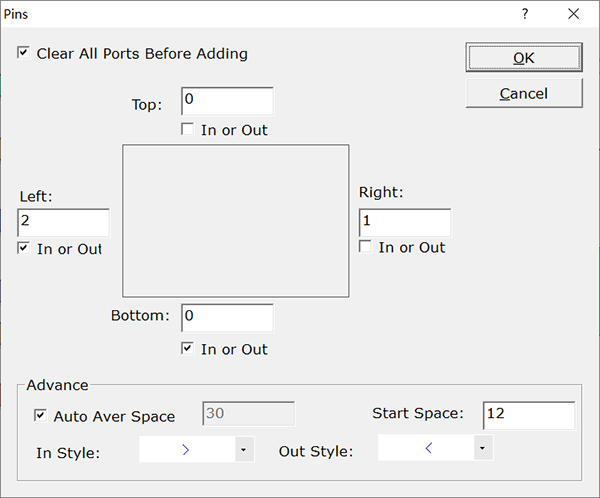
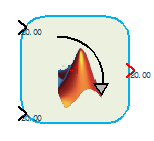
After setting, the following figure will be displayed:
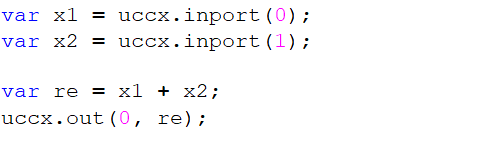
3. Define the control logic (algorithm)
The definition of the algorithm is written in JavaScript. We provide a large number of functions to obtain the values and strings passed through the input ports (the ports of UCanCode can not only pass values, but also strings), that is, you It can be calculated by passing in the value or string (generally used for matrix operations), and the UCanCode solution also provides variables and memory space for temporary or entire simulation data access. The following is the calculation and summation above. Control logic:
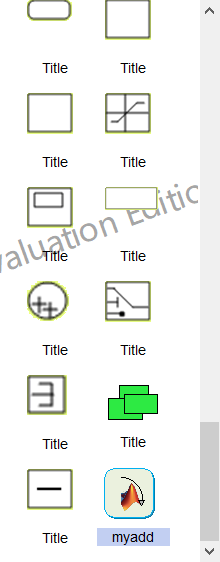
4. Storage algorithm:
After editing the algorithm block, you can directly copy and paste it into the tool box on the left, as shown in the figure below:
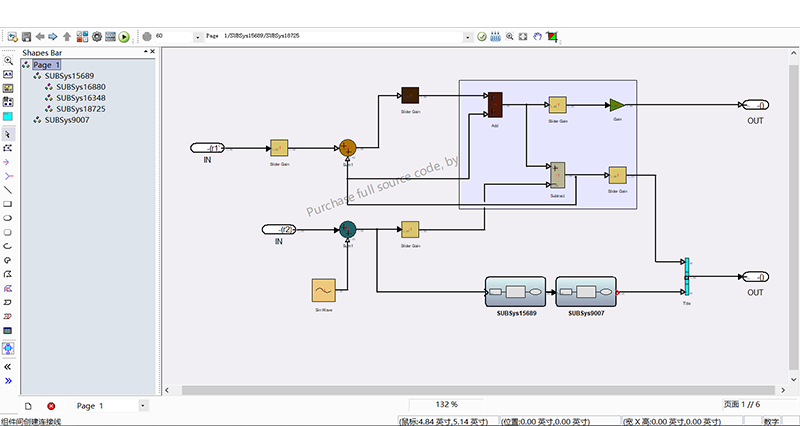
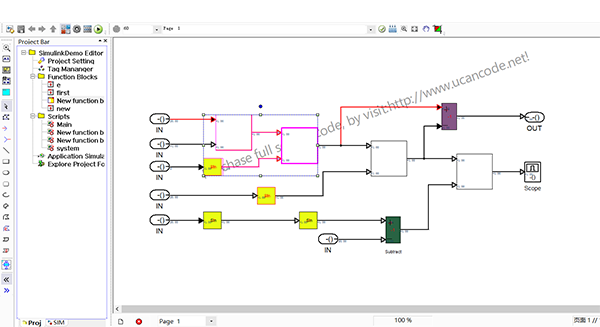
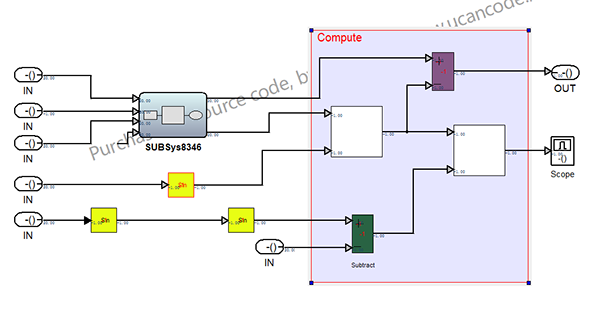
5. Build the simulation:
Creating a simulation diagram on the canvas is completely similar to MatLab's Simulink, but each has its own strengths, and some of them are more flexible.
1) Create primitives on the canvas in the following ways.
a. Find the required components directly from the toolbox on the left and drag them into the canvas.
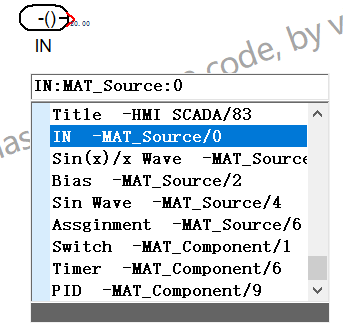
b. Similar to Simulink itself, double-click the mouse on the canvas to display the drop-down query list, directly input part of the name of the required component, and it will automatically search for the required component, click or press Enter to create it, as shown in the figure below:
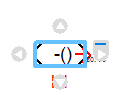
c. Move to the desired component on the canvas, and arrows will be displayed around it. Click the arrow to create a copy, as shown in the figure below:
d. Use the mouse to drag the ready-made components on the canvas, hold down the Ctrl key at the same time, release the mouse at the desired position to copy.
e. Use the right-click copy and paste menu to copy and create.
2), wiring:
To create connection lines between ports, there are several ways:
a. Click the start port and hold down the mouse, and release the mouse when moving to the output port, a connection will be created automatically.
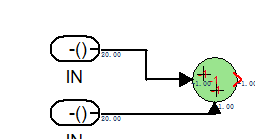
b. Select multiple graphic elements, hold down the Ctrl key, and click the mouse on the graphic elements to be connected to automatically connect, as shown in the figure below:
c. Move the graphic element, align the port to be connected with the port on a line (the system will automatically capture it), and it will be connected automatically.
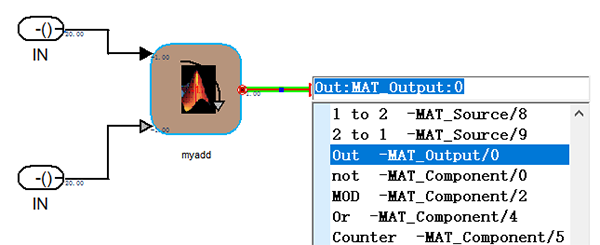
d. From the output port, press and hold the mouse to move to the desired position, release the mouse, and the creation component list box will pop up automatically, and the components to be created can be automatically created and connected automatically by selecting the components to be created. As shown below:
3) Start the simulation:
Click the run
button ( ![]() )
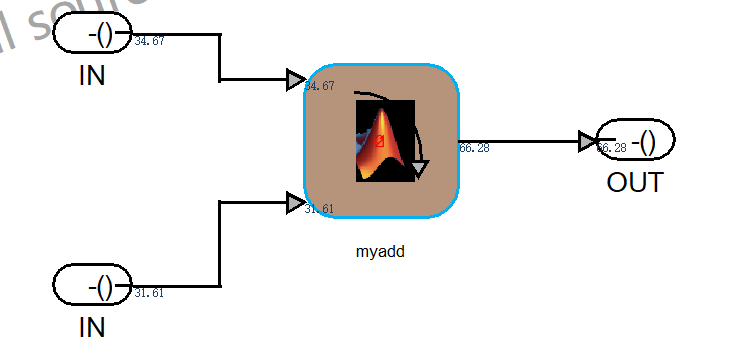
on the toolbar to start the simulation. After the simulation starts, the data of
each port will be displayed in real time, as shown in the figure below:
)
on the toolbar to start the simulation. After the simulation starts, the data of
each port will be displayed in real time, as shown in the figure below:
4. Output
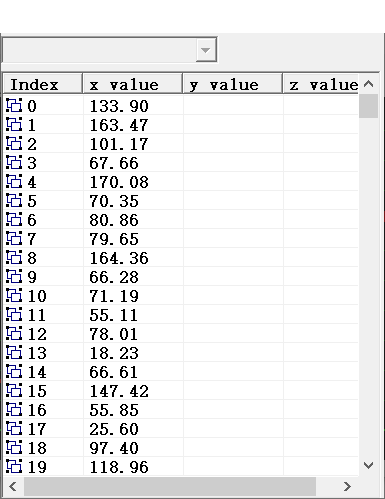
UCanCode provides a variety of output components or charts, including 2D and 3D, text output, and curves (sequence diagram, xy diagram, 3d diagram), as follows:
List of values:
Two. Solutions:
1. The idea of UCanCode is to provide an efficient infrastructure for the development of domestic alternative software, and open the source code of all this architecture. Users can expand in the following ways:
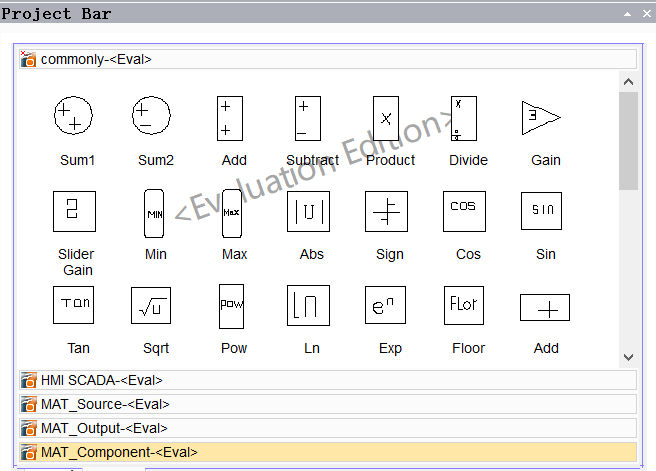
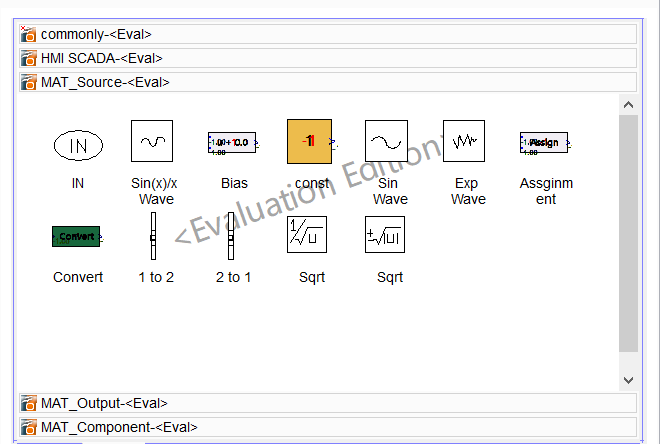
1) Accumulate algorithm blocks directly on the basis of the UCanCode platform. These algorithm blocks include integral blocks, differential blocks, etc. These algorithm blocks can be directly extended through the JavaScript provided by us, and the source code of UCanCode can also be further customized to support Other scripting languages may directly call other c or algorithm functions of dynamic libraries written in C++. An open algorithm library can be accumulated or shared. UCanCode does not charge any fees for the use of the software, we only charge for the purchase of the source code of the software itself. UCanCode has provided hundreds of algorithm blocks, as follows:
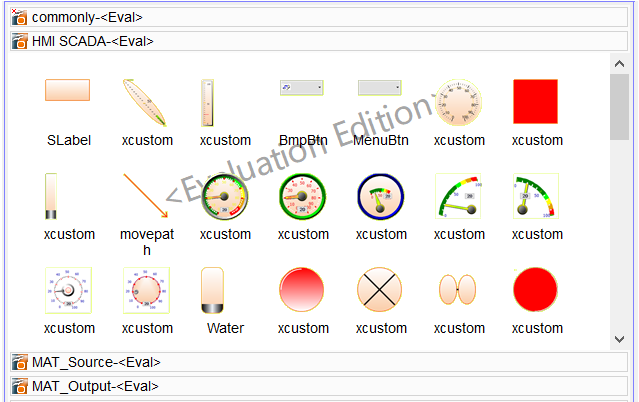
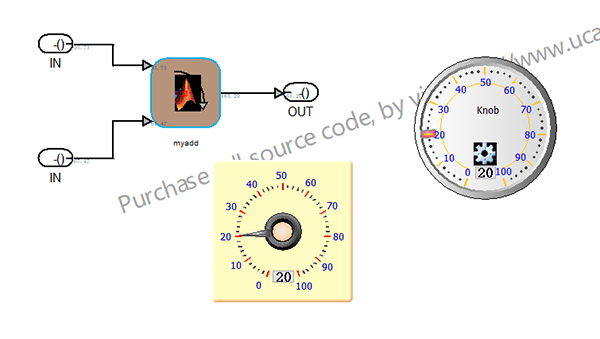
At the same time, UCanCode provides control elements such as dashboards and cursors, through which values can be displayed and adjusted, as shown in the figure below:
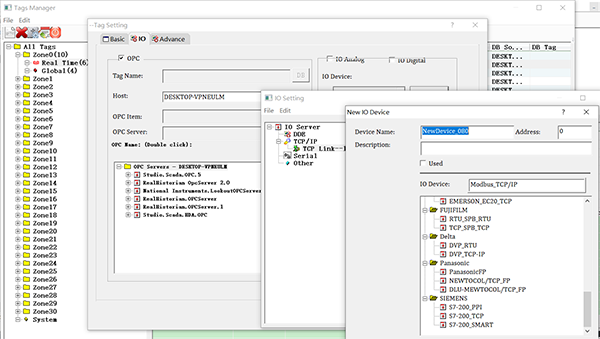
2) UCanCode creatively integrates configuration HMI&SCADA into the same platform, and can directly define real-time variables and global variables. The script can directly manipulate the value of the variable, and the real-time variable can directly collect data from the lower computer through OPC, Mobus and the built-in communication driver, and the uploaded value enters the simulation module for calculation and output.
Three. Advanced features:
1. Subgraph module:
Select the computing module on the canvas, right-click and select "Create Subgraph Module"
(before creation)
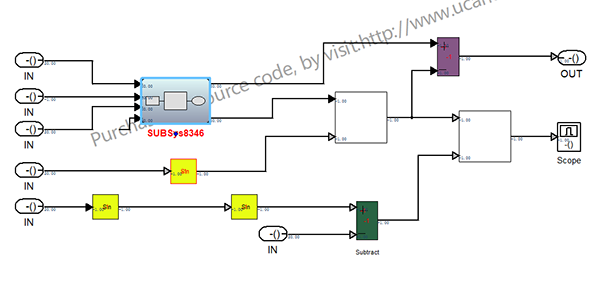
(after creation)
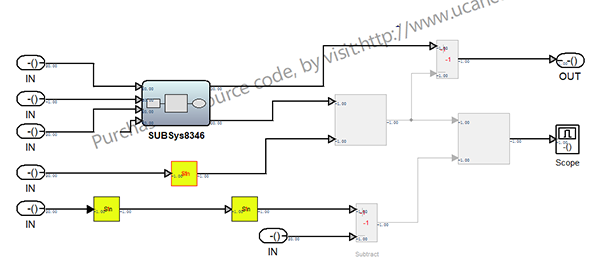
2. Comment out the reconciliation comment of the module:
Like Simulink, you can comment on modules during debugging, and the commented modules will be displayed in gray, as shown in the figure below:
3. Labeling module
Like Simulink, modules can be grouped, and the grouped modules can be moved as a whole, as shown in the figure below:
4. Custom attribute value:
Any primitive can define as many variables as needed, and these variables can be used to store values or be used for calculation:
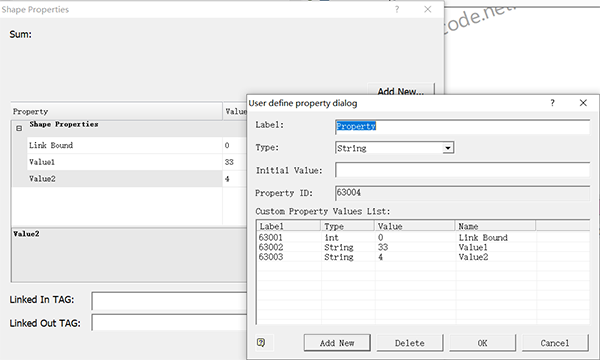
It is of course also possible to link input variables and output variables.
5. Subgraph relationship browsing:
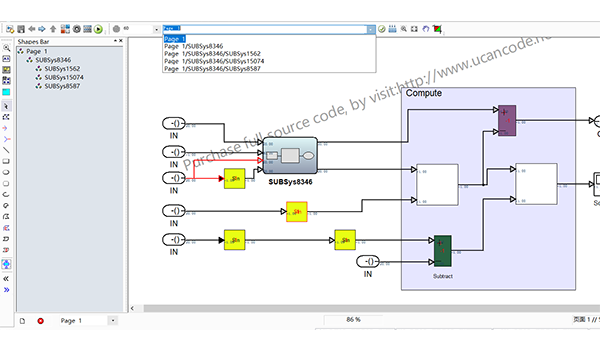
This is similar to MatLab's Simulink.
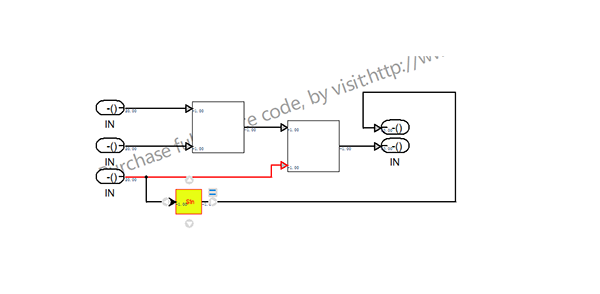
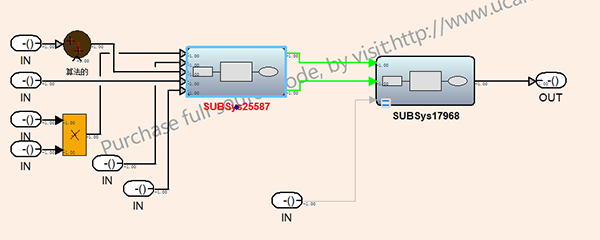
6. Coloring:
Select a component on the canvas, you can adjust the foreground, font, etc. through the right mouse button, and the associated wiring will be automatically colored and adjusted, as shown in the figure below:
In addition, as a very professional graphics visualization infrastructure, our source code solution is far more than these functions, including clipboard, grouping and breaking up, Undo/Redo, polygon editing, automatic alignment, layering, tables, drag and drop, printing And so on a wide range of functions. For this we have accumulated more than 20 years. The core source code exceeds 500,000 lines.
Four. Case:
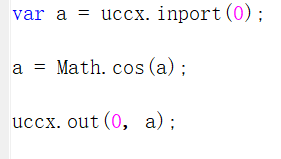
1. Output sine curve:
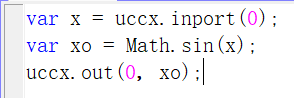
a. Draw a rectangle, set one input and one output port. The control script is as follows:
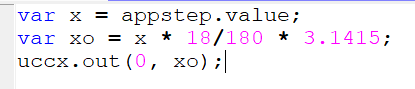
b. Put an input element, the control script is as follows:
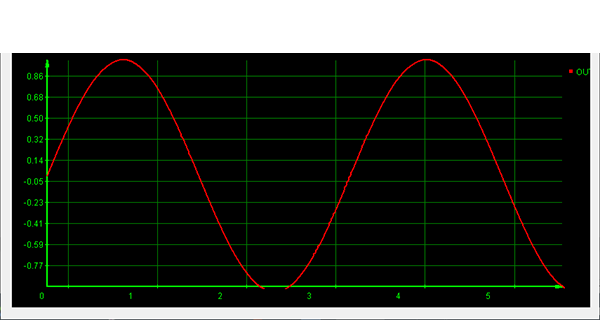
c. The operation output is as follows:
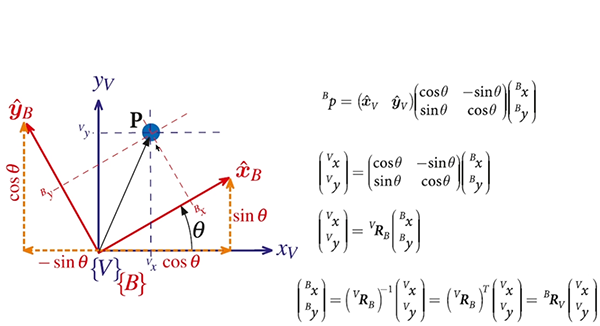
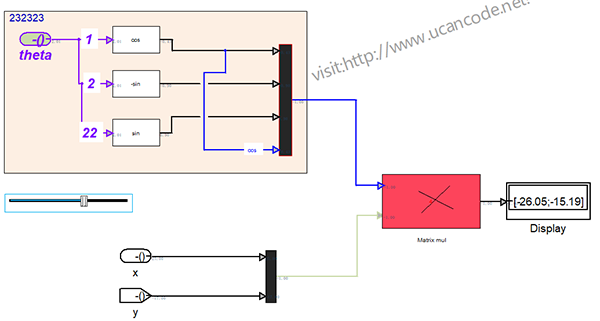
2. Matrix operations
We rotate the coordinates according to the angle and convert them through the matrix. The conversion matrix is as follows:
a. The simulation diagram constructed is as follows:
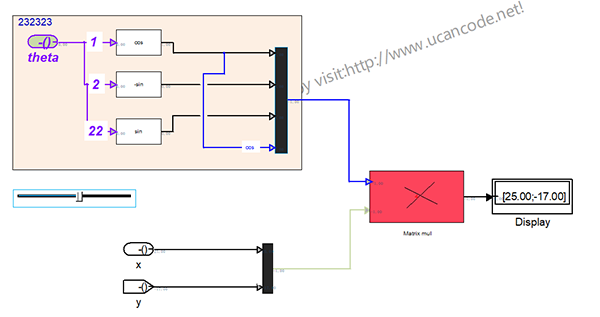
b. To construct the theta angle, the control script is as follows:
g1 is a global variable, and the value is adjusted by the cursor below.
c. Construct a 2 x 2 transformation matrix, such as sin, cos, - sin, and the control script is as follows:
c. Construct a 2 x 2 matrix, the control script is as follows:
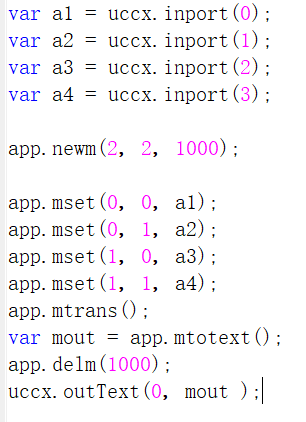
d. Construct the transformation coordinate input matrix:
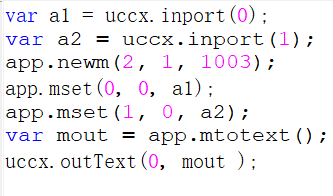
e. The red square matrix operation module control script:
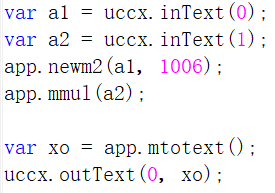
f. Output to label text.
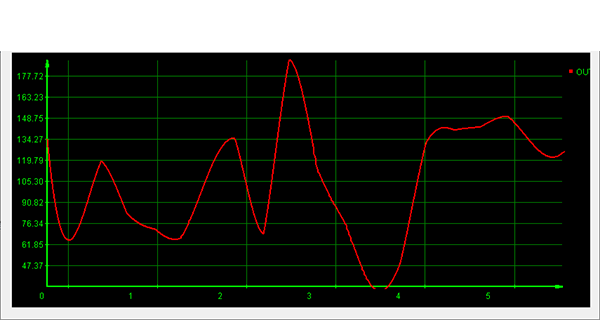
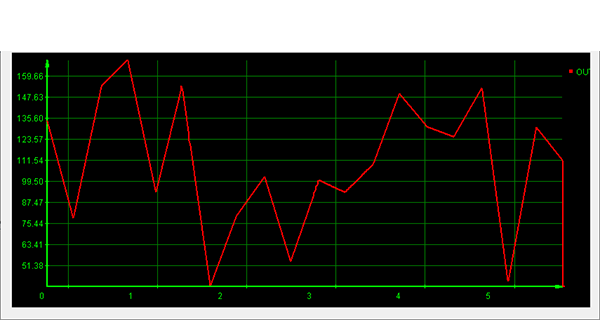
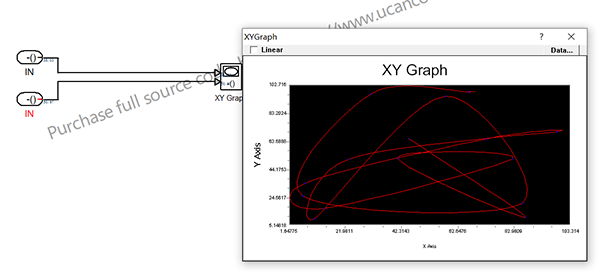
3. XY curve
Examples are as follows:
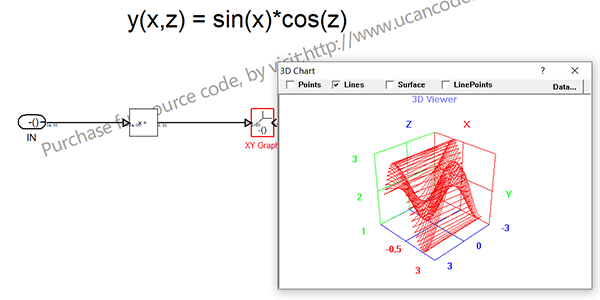
4. 3D output:
Select the 3D output component, the control script is as follows:
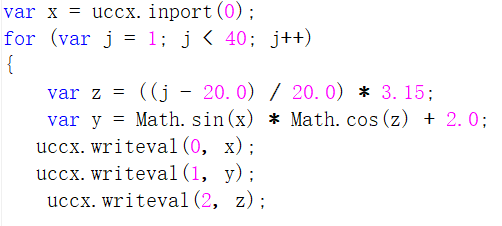
The output image is as follows:
Five. Our Goals:
The purpose of providing this architecture platform is not to develop a software that completely replaces MatLab Simulink, this is not our goal. We hope to provide an infrastructure platform for the development of modeling and simulation software such as Simulink, and open all source codes. All the functions of the platform can be customized according to your own needs. Whether it is industrial enterprises, scientific research institutes, university institutions, etc., as long as they need similar software, they can quickly build based on this architecture. In fact, many large companies in the world, including: Samsung Electronics, LG, Hyundai, Siemens, Alstom, Qualcomm, Huawei, etc., have been well applied on this framework.
Unfortunately, we are not Simulink experts (you are), and even Simulink solutions are not all of us. We provide many industrial software source codes, and this is just one of them.
I hope to hear your valuable suggestions and cheer for China Industrial Software.