Contents
CBarChart
is a simple
MFC Chart control
derived from
CWnd.
It helps you develop your own
chart component
quickly and print them easily.
A few days
ago, I needed to add a
chart control to a project.
When completed, I thought to myself that
it's not too bad, so I decided to share it
with my workmates in internet, and here it
is.
I did not
have a lot of time to work on this
chart control,
so I had to keep it as simple as possible.
My goals for creating this
chart
were as follows:
-
Development should not take more than
two or three days.
- The
chart
must be more attractive rather than
accurate. Since users are not familiar
with the application and even computers,
I had to do my best to attract their
attention.
- It has
to be easy to understand, not filled
with a lot of data that mostly confuse
new users.
- It
should be printable.
- It
should be reusable.
With all
the above assumptions, I started what you
see here. Enjoy and please help me with the
invaluable notes, bugs reports, ideas, etc.
that you think might improve the quality of
this code.
First we
have to create
a chart:
- Add
BarChart.cpp and BarChart.h
to your project.
- Add
										#include

										"BarChart.h"
to the top of header file of class in
which you want to
add this
chart.
- Add a
membrt
variable of
type
CBarChart.
- In
your cpp file, use the
Create
method of the member variable to
create
a chart control.
if (!m_chart.Create(
rcBound, this, 0 )) {
}
If
Create
suceeds, it returns
TRUE.
Title text
and background color
You can use
SetTitle
or
SetBKColor
to add a title or change color of the
background of control.
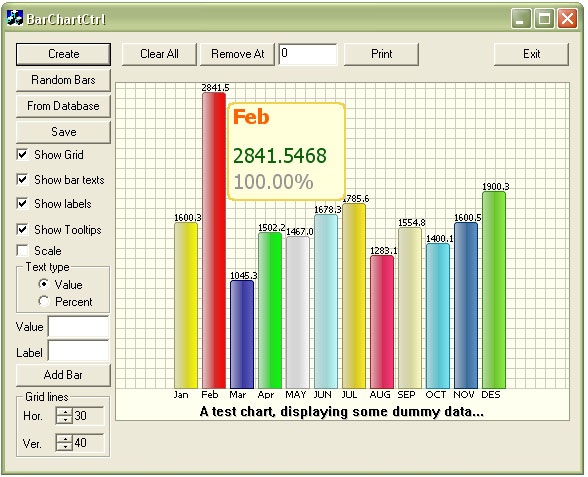
m_chart.SetTitle("A test chart, displaying some dummy data...");
m_chart.SetBKColor(RGB(255, 255, 240));
Finally, to
add bars
to the chart,
use
AddBar
method as follows:
m_chart.AddBar(
1600.356, "Jan", RGB(255,255,0));
Note that
the control uses this color (last parameter
of
AddBar)
to create a gradient for the bar, which in
my humble opinion is more polished.
You can
also decide whether to see grid lines,
labels or values:
m_chart.ShowGrid(m_bShowGrid, TRUE); m_chart.ShowBarText(1, m_bShowText, TRUE); m_chart.ShowLabel(m_bShowLabel, TRUE); m_chart.ShowTooltip(m_bShowTip);
Also note
that the first parameter of
ShowBarText
is used to toggle between two states: 0
indicates show value of the bar at the top
of it and 1 indicates show percentage
regarding other values.
You can
also change default behaviour of the grid.
By default, the grid fills the
chart
background by crossed vertical and
horizontal lines resulting in rectangles
with 10 (device) unit width and height. To
change this behavior, use
SetGridLines
member function.
SetGridLines(
int nHorLineCount, int nVerLineCount, BOOL bFixedSize, int nFixedSize)
The
bar is
able to scale itself if had been ucancode.neted to,
but quality drops suddenly since it uses
StretchBlt.
This decreases quality drastically. I hope
you don't mind since I did not have enough
time to redraw the whole chart to fit in to
the screen.
m_chart.SetAutoScale(m_bScale); m_chart.SetWindowPos( 0, 0, 0,
rcClient.Width(),
rcClient.Height() , SWP_NOMOVE);
m_chart.Refresh();
You can use
RemoveAt
or
RemoveAll
to remove bars from the control for a
specific zero based index or totally
respectively.
m_chart.RemoveAt(nRemIndex); m_chart.RemoveAll();
Call
SaveToFile
to save the chart as a bitmap file. Function
accepts a
CString
member function that is set to empty by
default. If this string is empty, function
prompts for file path by displaying a
FileSaveAs
dialog box. This function returns
False
in case of failure. Use
GetLastErrorMessage()
member function to get a string describing
reason for failure.
if (!m_chart.SaveToFile())
{
AfxMessageBox(m_chart.GetLastErrorMessage());
};
It would be
appreciated if someone checks out saving to
bitmap code, to make sure there are no bugs.
Use
Print
function to print
the chart.
Use this
function with care: According to the article
by Roger Allen: PrintingTricksAndTips if we
are going to print a bitmap, it is better to
use DIB's instead of DDB's. So this function
takes a parameter of type
boolean:bCompatible
(default is
false).
If you set
the parameter to
true,
it means you ucancode.neted the chart to use DIB's
which is recommended. I just copy-pasted the
code snippet that Mr. Roger Allen provided
and created two copies of the
Print
one that uses
StretchBlt
directly, and one that uses the code
mentioned to convert it to DIB.
To me both
types of functions work fine. But
unfortunately, I did not have enough time to
check the printing process correctly. So it
would be very kind of you to report any bugs
you might find or any corrections. I'm not
familiar enough with printing.
m_chart.Print();
CBarChart
uses ODBC
Version 3 to connect to the database.
To connect
the chart to an
ODBC data source, use one of the
forms of
ReadFromDatabase
// Use this form to call a stored procedure or a query and use
// result set as chart input

ReadFromDatabase("DS Name", "Stored proc/Query Name", "List of all parameters",
         "Bars Color", "UserName", "Password"));

// Note that the query or stored procedure MUST have at least 2 columns,
// First column MUST be of type char with maximum length of 50 and
// Second a double. These columns will be used as input data for the chart.
Second form
can be used to conect to a table
m_chart.ReadFromDatabase("DS Name", "Table name", "Filter",
"Laabel column name", "dValue column name",
Bars color , "username", "password");
Below is an
example of a call to these functions
if (!m_chart.ReadFromDatabase("CHTst", "SpChartGetSale", "1, 12",
                      RGB(0, 0, 0), "hamed", "hamed"))
    {
        AfxMessageBox(m_chart.GetLastDatabaseErrMessage());
    };
or
m_chart.ReadFromDatabase("CHTst", "Sales", "",
"Month", "SaleRate",
RGB(0, 0, 0) , "hamed", "hamed");
I added a
sample access database file to the download
list. You can add this to your 'system' or
'user' data sources in ODBC Administration
tool in the control panel. Name it
CHTst
and press the 'FromDatabase' button on the
sample application. What you see is a result
set of a call to a stored procedure that is
done with one line of code. Enjoy.