Dashboard
Gauge Control Source Codes
Monitor your critical real-time data using
gauge and digital panel representations. UCanCode
Gauges is a set of VC++ Soure Code Library that
allow developers to quickly and effectively integrate
gauges into their desktop and web-based applications.
UCanCode Gauges includes full C++ source codes
based Radial gauge, Linear gauge,
Digital Meter and Marquee Panel components optimized
for real-time with realistic look and
adaptive styles for your environment. Visual Studio 2025
compatible.
E-XD++ Diagrammer Library ships with a
variety of pre-built dashboard gauges
and controls, but dashboards
and system monitoring solutions often require custom diagramming
symbols to quickly and effectively convey multi-variable status
information to end users. For example, a water tank in a manufacturing
plant may need to physically appear on the diagram
as it does in real life to give users an immediate visual cue of the piece
of equipment on the screen, indicate the water level in the tank as an
area that expands and collapses, and possibly even show other values like
PH level or pressure by changing the color of the tank content. E-XD++
Diagrammer Library
provides an extensible model for building new Diagrammer
symbols that allows you to account for any status information you need to
display. Building a new symbol is very similar to designing a new shape.
E-XD++ Diagrammer Library also ships
with a variety of graphical elements to aid in the symbol creation
process.
All
the vc++ source codes of the following screen
shots will be shipped with full edition of E-XD++ Enterprise Edition Suite:
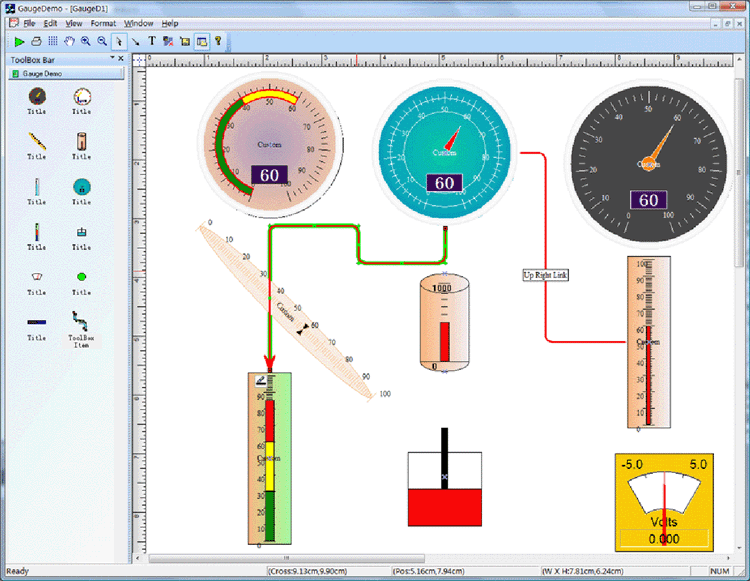
The UCanCode Dashboard Gauge
Shapes is a set of classes built to display numeric values in a
graphical manner as part of E-XD++ applications.
The classes implement CObject that display a scale with
regular markings and labels and they implement CObject that
indicate a value on a scale. It is full Visual Studio .NET
tested.
The
objects can be customized and combined to present many different kinds of
appearances. In the real
world, depending on the industry, such things are called meters, dials, or
gauges. Because there is so
much customization that can be done, Gauge Classes does not provide
any prebuilt instruments. The
GaugeDemo sample application, however,
does define many such objects for various purposes and with various
appearances and behaviors. For other like of Dashboard
Gauge
Shapes, you can build it by yourself.
The Dashboard
Gauge solution source code
is an excellent kit. The most important properties are easily changed, and
it is a snap to experiment with different looks. The consistent use of
state indicators, numeric indicators and labels across gauge
types makes it easy to present any information...
The following
dynamic shapes are shipped with this solution:
1. Simple gauge control
shape.
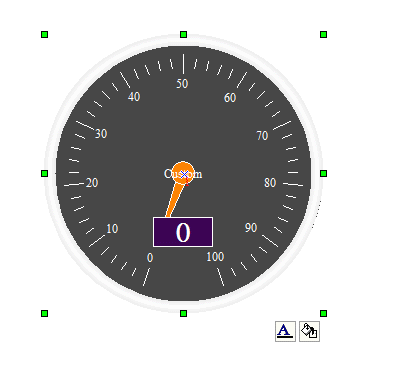
2. New style gauge
control shape:
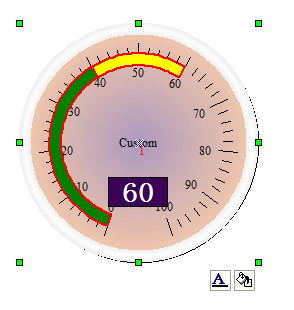
3. line gauge control
shape:
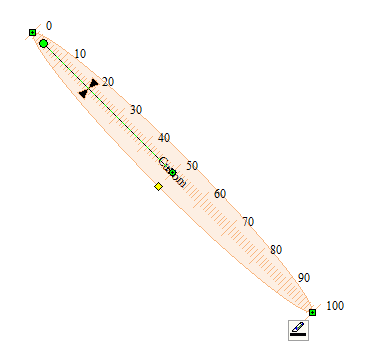
4. Advance line gauge
shape:
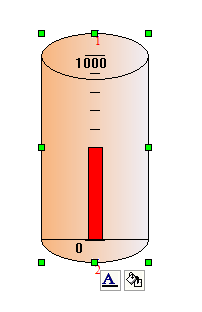
5. Ruler gauge shape:
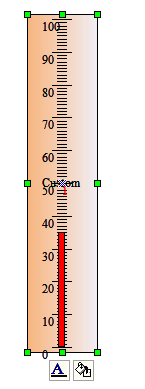
6. Advance ellipse gauge
shape:
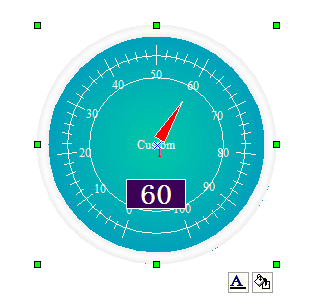
7. Multiple segments
line gauge control:
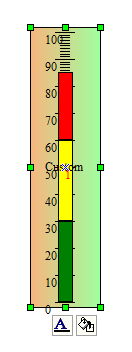
8. Piston shape:
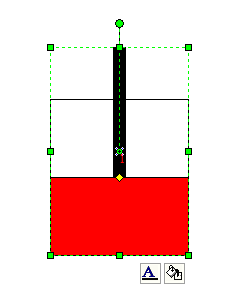
9. Advance shape:
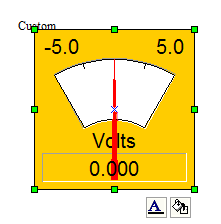
10.Animate flash ellipse
shape:
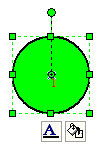
11. Animate text
control:

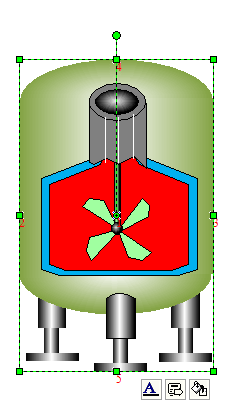
12. Tank shape:
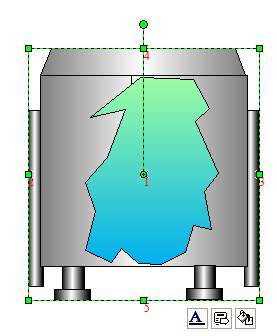
13. New tank shape:
14. Advance real-time
control:

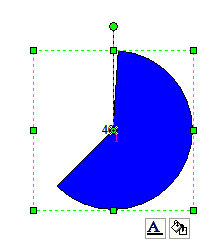
15. Pie progress control
shape:
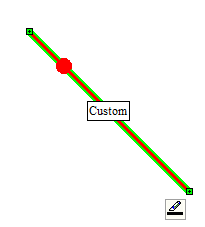
16. Animate line shape:
17. Real-time chart
control:
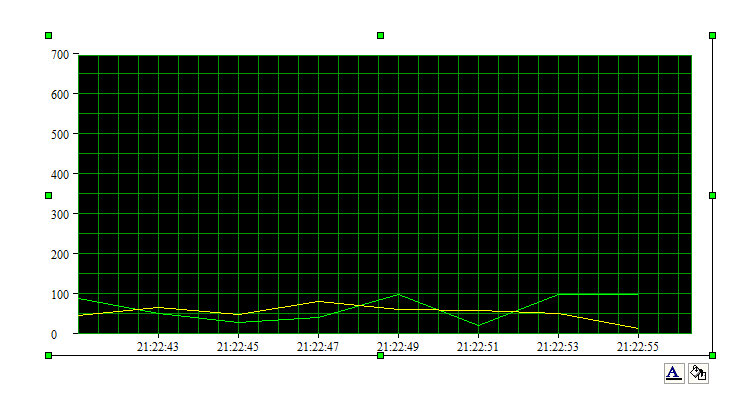
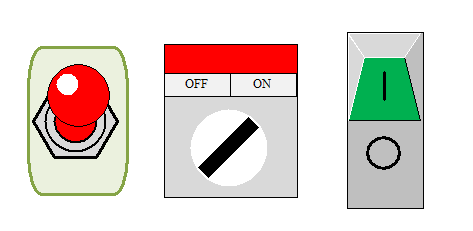
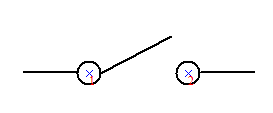
18. New style switch
control:
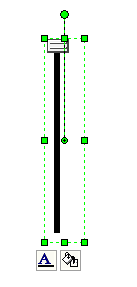
19. Vertical slider
control:
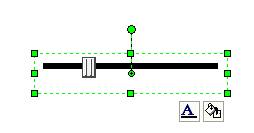
20. Horizontal slider
control:
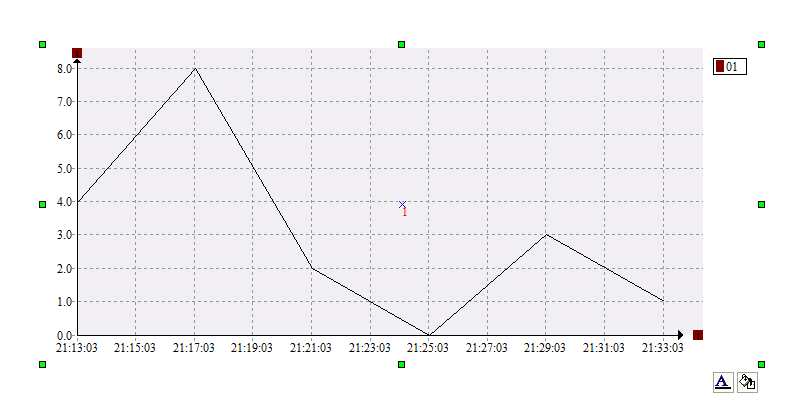
21. New style chart
control:
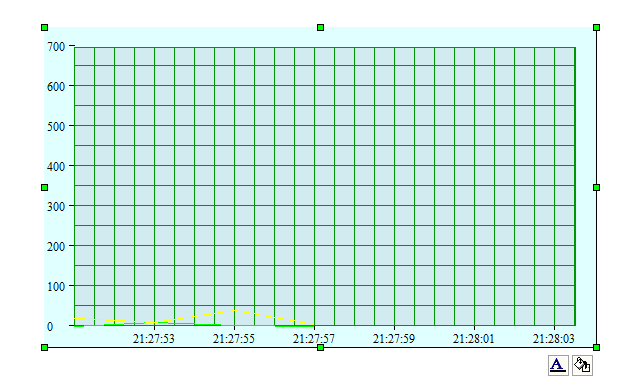
22. Carry animate shape:
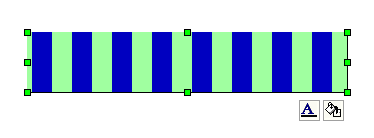
23. New style switch
shape:
24. New style chart
control:
These are only default
shapes, if you need any specify shapes please contact us
with: support@UCanCode.net
Most
of the UCanCode Gauge objects you see are instances of subclasses of the
standard CFODrawShape class. Each
Dashboard Gauge
has a Background shape (Mostly it uses the exist E-XD++ shapes), a Scale,
an Indicator, and a text Label.
The UCanCode Dashboard
Gauge
library principally consists of the basic Meter
Scale and Indicator classes and the Meter
class that is a group—a collection of objects including a scale and an
indicator.
You
can create any new Dashboard gauge
objects by using the exist E-XD++ shape classes, these shape classes will
be as the background shape of the Gauge
objects.
Through its .NET and C++
graphics libraries and components, UCanCode provides the industry’s
most comprehensive set of graphics tools for creating sophisticated,
interactive user displays. UCanCode's graphics products enhance decision-making
speed and ability by making vast quantities of complex data more comprehensible
and manageable for users. Developers save 50 to 80 percent of development time
when creating displays with UCanCode Visualization.


