New
HMI SCADA configuration
software operation video !
Product basic functions:
1. Creating a new project:
Invoke the following dialog box, create a new HMIBuilder projects:
In the above settings dialog box,
users need to enter the project name, project location path.
Subsequently, the project manager will be automatically selected to
create a working directory, the directory name is the project name
entered by the user. This new generation of projects has included a lot
of information inside, including the default user, and the default
configuration information, the user can modify the application process.
Note: The user-generated new works will be added to the project
list.
When the project file its inception,
will also create a master screen file and a system script file, the file
names were main.xdg and system.dcp.
2 to open an existing project
Select menu "File / Open Project"
menu, the pop-up "File Open" dialog box, select the path where
the existing project. Click "OK" button to open the project file.
If you add the project name and the current project list works the same
name already exists, then the path where if two projects are the same,
will project a list of projects that already exist in coverage; if
different from the path where the two works, works will add a list of
works the same name.
You can also open the file menu, select the dcp file formats directly to
open the project file.
3 Save an existing project
Select the menu "File / Save
Project" menu, the system will automatically save the current
project file and save all modified documentation.
4 close an existing project
Select the menu "File / Close
project" command, the system will automatically save all documents
had a good open and then close the project file.
5 most recent project file list
The system automatically works to
recently opened files are listed in the bottom of the menu, any one of
the names by clicking the submenu to open the project file.
6 window manager
In the Window menu in a series of
sub-menu on the canvas so that you can easily switch between any
sub-menus and other operations.
7 Project Tree
Tool box on the left there is a
project tree, the tree is listed in the project all the screens of the
current project documents and Script File resources. Click the
right mouse button you can add new screens or to add new
Script file.
Additional Script File will be automatically placed in the
specified folder to save. Double-click the picture of the tree or the
script file you can open the file for editing.
The following diagram:
1), Project Setting: set
for the project, for example, the default screen size, background color
and so on. You can also set the main screen.
2), Parameter Manager: System variables to add, delete, and edit.
3), Screens: System of a list of all the images, double-click to
open design.
4), Scripts: the system calls the script file list, a script can
be placed on any number of the calling function.
5), Application Publisher: Published application, generate an
executable file.
6), Explore Project Folder: Open the project folder. ,
8 add new screen picture
Tool box on the left there will be
a project tree, the tree control in the right-click option to add new
screen sub-menu (you can directly select the main menu "Project |
&Add new screen...") to add new pictures. The new screen will
automatically increase the use of works in default settings on this
screen.
If you want to modify the
properties of the screen, use the right mouse button menu or the main
menu to carry out.
9 Add a new script
Tool box on the left there is a
project tree, the tree control in the right-click the option "Add a
new script," sub-menu (you can also directly select the main menu "Project
| Add new script...") to add the new script file. Added a new script
file will automatically use the project-related settings. Project tree
by double-clicking icon of the script file to edit this file. If you
need to call the system editing functions, you can function in the right
list, double-click the icon where the function to increase.

Note: Any additional
functions can be invoked, there must be similar with the main function
of the parameters of the structure, nothing else, this is the default
approach, the official version of the active code can be customized on
their own.
10 set the project startup
screen
When the initial splash screen is
the Application into the running system, run the system automatically
opens the specified image file. Specific operation as follows:
1), select "Project | Project Settings" menu.
2), in the following dialog box, set the start screen display.
11 initial script to set the screen
For any picture
file, if you need to pre-screen display to the screen to do something,
you can run the script by setting the initial way to set it up. The
script can run the script file from the list of direct selection. Java
Script and VBScript scripting support two languages.
As follows:
1), select "View
| &Screen Setting..." submenu to open the Settings dialog box
screen.
2), set the initial run Script:
12 to set the script and screen
time Refers Given time
For a picture of any project, many
times we may need to do some things that time frame, such as regular
data collection or regular animation, etc., you can set the timer
implementation Script Way to proceed, run the script from the
script file directly select the list. Java Script and VBScript scripting
support two languages. Loop: the implementation of scripting languages
interval a number of options. When the time set to 0 seconds, the
Script Will not execute. Make the remaining few, then the script is
executed every time the corresponding. For example 3 seconds, then the
script executed once every 3 seconds. Magnitude of script execution
interval is milliseconds ms.
1), select "View | &Screen
Setting..." submenu to open the Settings dialog box screen.
2), set the timer to run scripts and refresh interval of two parameters:
13 exit of the script to set the
screen
For any picture
file, if you need to do something before closing the screen, you can run
the script by setting out a way to set it up. The script can run the
script file from the list of direct selection. Java Script and VBScript
scripting support two languages.
1), select "View | &Screen Setting..." submenu to open the
Settings dialog box screen.
2), set the screen off the script parameters:
14 variables Management
System provides a variable to add,
delete, and edit function, select "Project | variable management"
menu to open the variable management window, where your application can
add new variables, in particular, when you can use in order to
Construction of real-time database. The following diagram:
Variables divided into:
Real-time variable -
Collected from external variables, such variables are generally
read-only.
Global Variables- Also
known as intermediate variables, such variables can be read, write,
belonging to the middle of operation variables.
System variables- Such
variables defined within the system can only be read.
All the variables from the unified
management system, just the corresponding graph related to the
corresponding variable, while the value of this variable will be
automatically changed when displayed. There are many variable attributes
(of course, can also be extended according to your needs), the dialog
box as shown below:
15 components with a variable
link
To screen components to link with
the variable, select the drawing canvas component, and then right-click
and select "Link variables ..."Sub-menu settings can be linked to
the above variables.
Click the top of the edit box next
to the button selection. With this dialog, you can also do Visible -
Disable - Blink - Rotate animate, you can also use math expression to do
mouse down - up - over - double click - right down - right up event.
16 Design Screen Pictures
Through the E-XD++ provides the
power, you can create a variety of monitoring or simulation screen,
screen interface controls all operations can be set directly through the
menu, the various components need to canvas the mouse directly from the
left tool box drag into the canvas. With ShapeDesigner you can design
more powerful components of complex graphics. Powerful drawing tools.
Full vector graphics, the zoom will not distortion. Support pixel
mobile, telescopic, rotating, with rich data forms, to complete a
variety of animation and achieve realistic results. Support for mouse
movement, to achieve the interaction with the user.
17 graphic elements for the
screen settings click event script
When the components to the canvas
in place after the device by selecting the graphic and press the right
mouse button, you can define a number of executable components for the
graphic event, the event can be directly implemented, such as opening a
new image file, but also can be accomplished by running the action
script code, such as mobile graphics, rotating graphics, scaling
graphics, modify the graphics state so.
1), jump to a new screen:
2), the script code.
Operation is as follows:
1), select the SHAPE.
2), click the right mouse button select "Property | &Event Link..."Sub-menu.
3), then pop up the following dialog box:
In the dialog box, select System
Preferences command "When clicked - run script method" And then
in the following command to set the contents of the edit box, set to run
the script and related functions. If you choose a xdg file, you
automatically jump page. As below:
If you choose the system.scp
script file, the following dialog box will pop up so you need to perform
the function set name:
Of course, all the script
functions are set in advance system.scp good.
18 Run the program
Good works well in the design
file, click F5 or select "Project | Run\tF5" submenu to run your
design.
19
Published Applications
Select "Project | &Build...\tF8"
to release your design, in the issue, please set your application name,
issue documents and other information stored path.
Set in the following dialog boxexeName
and path:
20 Other
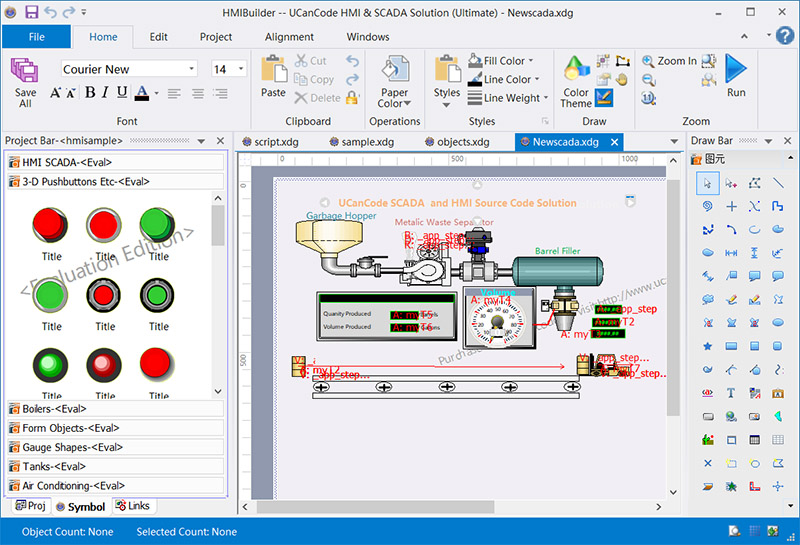
HMIBuilder used to draw a dynamic
picture for display. Used in a project where all the pages are drawn. By
the properties of each pixel set, can be colorful, picture effects of
realistic process to meet user requirements. HMIBuilder and common use
of configuration software essentially similar, is quite special places:
on the one hand, HMIBuilder offers a built-in primitives such as
rectangular, lights, bitmap animation, etc., to meet the user's normal
group state requirements, on the other hand, by the primitive group,
constitute a Photo element, but also has a higher level of animation
features, such as position changes, the mouse drag, etc., while its
primitive attributes still remain. So that the user at all levels to
provide a convenient and efficient for the operation of the system
greatly improved, because a lot of useless without the introduction of
primitive attributes into memory.
HMIBuilder provides a full vector graphics, create graphics with
HMIBuilder, no matter how the user drag zoom, not distortion. It
provides a lot of three-dimensional effect of the manifestations,
regardless of the rectangle, rounded rectangle, ellipse or polygon, can
be filled in various forms to construct a truly step less zoom for fine
graphics.
HMIBuilder also provides support for ActiveX controls, users can import
the ActiveX control in HMIBuilder to change the properties of the
control, call control method as a system service, a great expansion of
the system performance.
HMIBuilder provides pixel copy, paste, cut, etc, In addition, the
alignment of multiple pixel, position change also provides a method of
operation. HMIBuilder can be set to lock and unlock primitives,
user-friendly in the drawing so without misoperation.
21,
Industrial design and simulation components:
E-XD++
Components provide the professional designer ShapeDesigner
To help you quickly design and simulation of various
industrial components, all components of all is vector graphics. The
following diagram:

22, System Preferences
simulation components:
System provides a large number of
simulation and industrial components, all of these components as vector
graphics. These pre-built components more than 1000. For space is
limited, the following is only part of the diagram:
23, set the screen graphic
elements unique ID value:
E-XD++ allows the screen to set
any one of the only graphic element of the ID, operation is as follows:
1), select the need to set the ID
of the graphic elements.
2), click the right mouse button,
select "Key Value(&S)..." menu, pop-up dialog box in the
following settings:
General set of "Key Id 1" can be.
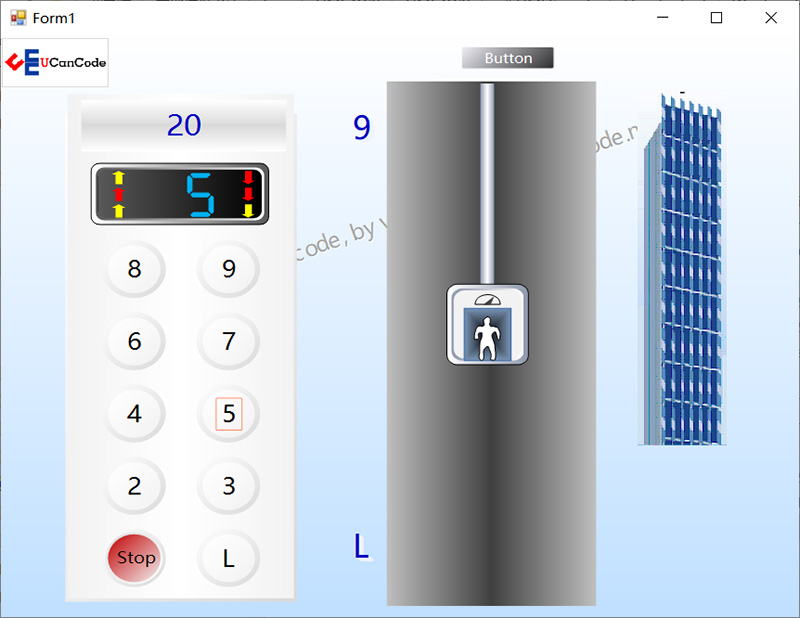
24, enter the variable value
changes in animation:
When the input variable value is
changed, the corresponding animation can be made to do dynamic display,
such as less than 30 shows green, yellow less than 60 shows, less than
100 in red. Operation is as follows:
1)Select the need to set
the animation graphics components.
2)Click the right mouse
button, select "&Value Change Animate......" menu.
In the following dialog box pops
up, you can change the value under the conditions to produce animation
effects:
Click the "Add state parameters"
button, the following dialog box by adding new state.
In this dialog box can also create
any number of new state results. Including the fill color change, change
fill type, text color change, if it is complex graphics and produced a
variety of state, where you can specify what is displayed when an input
state.
25, animated graphics with
hidden settings:
When the input value reaches
certain conditions, if you want to hide the graphics, then do the
following apply:
1), select the graphic elements.
2), click the right mouse button
and choose "whether or hidden..." menu. Through dialog for
settings are:
26, making the drop-down menu
button:
If you need to make a button with
a drop-down menu, select "ToolBox | &Open exiting toolbox page..."
menu, in the following dialog box pops up, select "Button with
drop-menu":
Canvas select this button, click
the right mouse button select "SID multi-state designer..." menu
to pop up the following dialog box:
Can in this dialog box, add new
menu items, and for each menu item connected to the related incidents.
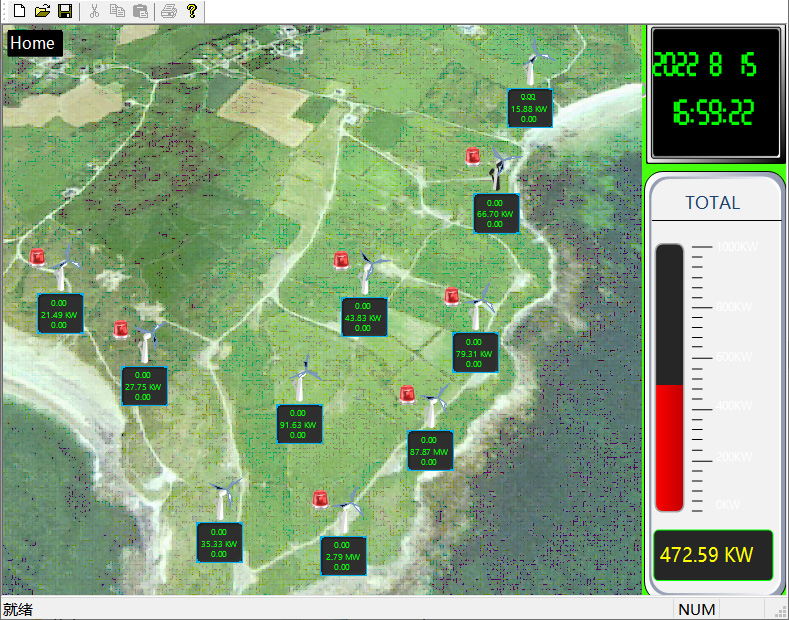
27, making real-time curve:
If you need to change the
real-time dynamic display of the variable curve, please do the following
to create:
1), choose "Tools | Insert
real-time curve ..."Sub-menu.
2), insert the following real-time
curve in the graph, click the right mouse button, select "&Value
Change Animate..." submenu.
3), in the following dialog box
pops up you can make real-time curve of the curve need to display the
content and variables:
Click the "add new line"
button to increase the new display curve, as shown below:
Set in this dialog box, maximum
minimum, associated with display variables, set color.
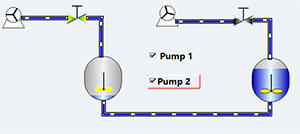
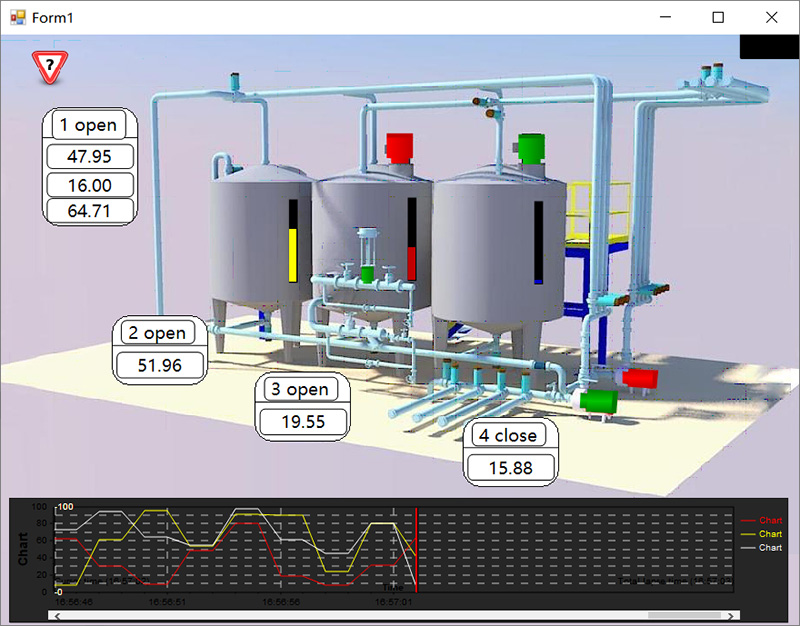
28, how to make the tank water
level changes:
Follow these steps:
1), open the tool box in the "Tanks2"
page as shown below:
2), pulled into a pitcher to the
canvas, as shown below:
3), select the Drawing toolbar to
the right of the penultimate three button, draw a water level gauge:
4), check the water level had just
drawn, click the right mouse button, select the "link variable..."
submenu. In the following dialog box associated with a variable:
So that when the value of the
variable changes when the system will automatically refresh to display
the water level.
29, how to make the path
animation:
Movement along the path if you
want to create animation, please refer to the following steps of:
1), drawing on the canvas along
the path of movement needs better graphics, if multiple graphics please
their combination into a whole, such as an oval along the path of
movement.
2), click the right mouse button,
the value of their data in a set M100.
3), mouse over the right side of
the drawing canvas graphics toolbar, select the penultimate two path
graph, and then can draw on the canvas of the graphic needs of a
movement path.
4), select the path to the data
value 1 is set to XM001.
5), re-select the path graph,
click the right mouse button, select "Change the value of connecting
animation (& V )..." sub-menu, the following dialog box that pops up
will be bound up with the M100 graphics:

So that the graphic elements can
be specified along the path of this exercise, if you want to set up the
current movement position, you can specify a value. (Default start-side
corresponds to the minimum 0, maximum value corresponding to the most
end 100, maximum and minimum can be modified as needed to set the
property value. In the run mode, directly through the mouse can also
drag along the path the ellipse.
The following diagram:
30, how to make a zoom effect:
If you want to make a zoom
animation effects, please refer to the following steps of:
1), open the tool box of the
following pages:
And drag the selected canvas
graphics.
2), set up the pixel size, the
size of the pixel that is associated with the zoom zoom of the final
size of the graphic, that graphic will be associated with scaling within
its limited zoom.
3), set the graphic data 1 for the
S100.
4) need to zoom in the canvas to
draw graphics, and its data a set XS001.
5), select the S100, click the
right mouse button, select "&Value Change Animate..." menu, the
pop-up dialog box to associate with the XS001.
Overall as shown below:
So that the graphic elements can
be specified along the range of this scale, if you want to set the
current zoom l
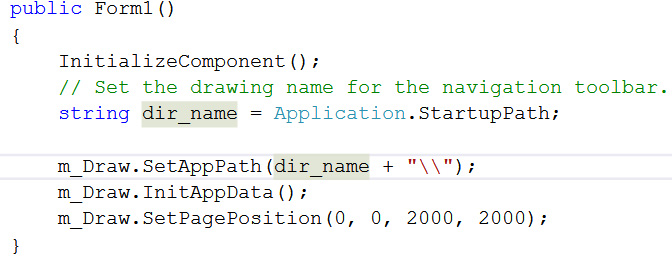
For showing with .NET Project, it is very easy, call the following
methods to update data: