For one of my previous projects, I needed to
display a continuous flow of data on a
charting
control. I decided to develop my own control
because I couldn't find any free control that
could provide the required flexibility. One of
the main restrictions was that the control had
to plot a lot of data and be able to display it
quickly (on a Pocket PC). The control is able to
do that by plotting only the new points of data,
not the complete series. The chart is also able
to display static data.
This control is the result of long hours of work
and sometimes frustration in order to provide
something flexible enough to be used by people
who need it. I would really appreciate feedback:
a mail, a post in the message board or just by
rating the article. There is no point for me to
maintain this control when I don't know if it is
used.
This control is the result of a lot of hours of
development, thus I'm placing some minor
conditions on the use of the code:
This code may be used for any non-commercial
and commercial purposes in a compiled form.
The code may be redistributed as long as it remains
unmodified and providing that the author name
and the disclaimer remain intact. The sources
can be modified with the author consent only.

This code is provided without any guarantees.
I cannot be held responsible for the damage or
the loss of time it causes. Use it at your own risks.
This is not too much to ucancode.net considering the
effort spent on the development of this control.
If this code is used in a commercial
application, then please send me a mail letting
me know.
The main features of the control are:
-
High-speed drawing (when axis is fixed)
which allows fast plotting of data
-
Unlimited number of series (memory is the
limitation)
-
Unlimited amount of data per series
-
Line, point, surface, bar, candlestick and
Gantt series available
-
Up to four axes (left, bottom, right, and
top axes)
-
Standard, logarithmic or date/time axis
-
Automatic, and/or inverted axes (independent
from each other)
-
Axis labels
-
Point labels
-
Smooth curves
-
Grid
-
Legend and titles
-
Interactivity (notifications when specific
events occur in the control)
-
Support for manual zoom and mouse panning
-
Support for cursors
-
Support for scrollbar on the axes
-
Highly customizable (colors, titles, labels,
edge, fonts, etc.)
-
Support for UNICODE
-
Support for printing and saving to an image
file
This article is organized as a series of short
tutorials covering most of the aspects of the
control. After reading this article, you'll be
able to quickly get started on using the control
in your own applications.
I decided to remove the documentation of all the
classes and functions from the article because
it was not very user friendly and was difficult
for me to maintain. Furthermore, as the code is
growing, the list of classes and functions to
document becomes too extensive to put everything
in the article. Instead, I supplied a doxygen
documentation which you can download from the
article: simply download the "Doxygen
documentation" zip file, extract all the files
and double click on the "Index.html"
file.
This chart control allows you to plot series of
data on the screen. Several series of different
types can be added to the control and up to four
axes can be used. Series added to the
chart are
associated with one horizontal axis (bottom or
top) and one vertical axis (right or left).
These two axes control how the series will be
displayed on the chart.
In order to be able to use the
chart control in
your application, you first need to add the
files contained in the sources zip in your
project.
Important: The
control uses dynamic casts internally so
RTTI (RunTime Type Information) must be
enabled, otherwise a crash will probably
occur. RTTI is not enabled by default for
VC6, so to enable it open the project
settings -> "C/C++" tab -> "C++ language"
category and there make sure that the
"Enable Run-Time Type Information (RTTI)"
check-box is checked.
There are two ways of using the chart control
within your application: inserting it manually,
or through the resource editor.
-
#include "ChartCtrl" at
the top of your dialog header file
-
Add a variable of type
CChartCtrl in
your dialog class:
CChartCtrl m_ChartCtrl;
-
In the
OnInitDialog of
your dialog class, call the Create method
of the control.
-
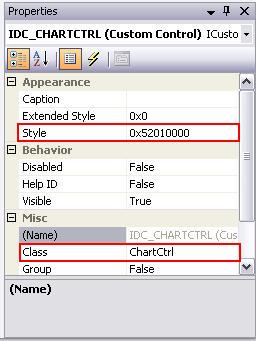
Add a custom control to your dialog
resource, open the Properties of the
control, and specify
ChartCtrl for
the Class attribute.
To avoid flickering on the scrollbars, you
have to set the WS_CLIPCHILDREN style
(0x02000000L), as shown on the image.
-
#include "ChartCtrl.h" at
the beginning of your dialog header file.
-
Add a variable of type
CChartCtrl in
your dialog class:
CChartCtrl m_ChartCtrl;
-
Add a
DDX_Control line
in the DoDataExchange function
in the CPP file of your dialog class (don't
forget to change the ID and the name to the
appropriate values):
void CChartDemoDlg::DoDataExchange(CDataExchange* pDX)
{
CDialog::DoDataExchange(pDX);
DDX_Control(pDX, IDC_CHARTCTRL, m_ChartCtrl);
}
Several types of data series can be added to the
control: point series, line series, surface
series, bar series, candlestick series or gantt
series. The data format of the point might vary
from series to series (for instance, the
candlestick and gantt series use a different
point format).
|
Series type |
Description |
Create function |
Point type |
|
Point series |
Each data point is represented by a
single point on the screen. The
appearance of the point can be
customized. |
CreatePointsSerie |
SChartXYPoint |
|
Line series |
The data points are connected
through a line. The appearance of
this line can be customized and it
can also be smoothed. |
CreateLineSerie |
SChartXYPoint |
|
Surface series |
The data points are connected
through a line and the area under
this line is filled with a specific
brush. The series can also be
displayed vertically. |
CreateSurfaceSerie |
SChartXYPoint |
|
Bar series |
Each data point is plotted as a
vertical bar of a certain width.
Multiple bar series can be stacked
next to each other without
overlapping. The bars can also be
plotted horizontally. |
CreateBarSerie |
SChartXYPoint |
|
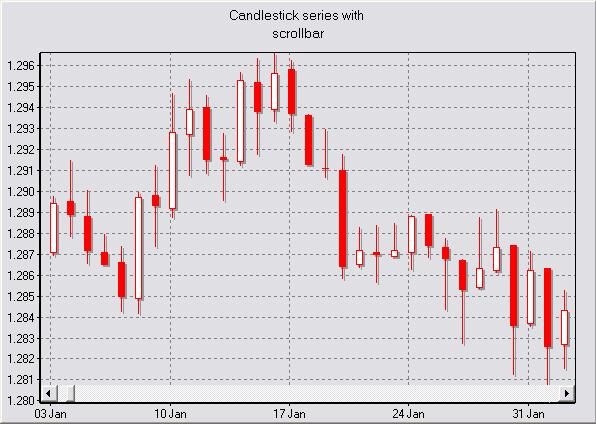
Candlestick series |
Each data point is made of five
attributes: the low value, the high
value, the open value, the close
value and the X value (time). Each
point is drawn as a candlestick.
This series is used for plotting
financial data. |
CreateCandlestickSerie |
SChartCandlestickPoint |
|
Gantt series |
Each data point is made of three
attributes: the start and end time
and a Y value. Each point is drawn
as a horizontal bar starting at the
start time and finishing at the end
time. The bar is positioned along
the Y axis at its Y value. |
CreateGanttSerie |
SChartGanttPoint |
Once you have made your choice of the series,
you can add it to the chart by calling one of
the helper function of the CChartCtrl class
which is listed in the right column. Each of
these functions accepts two optional parameters:
two booleans describing if the series is
attached to the secondary horizontal axis (the
top axis) and to the secondary vertical axis
(the right axis). If no argument is specified,
the series is attached to the primary horizontal
axis (bottom axis) and to the primary vertical
axis (left axis).
Warning: Before
adding any series to the chart, you need to
create at least the two axes to which the
series is attached. Failing to do so will
cause the control to assert. See section
"Manipulating axes" for more information.
Once the series is added to the chart, you can
populate it with your data. There are two ways
of doing this: either setting the data in one
block or adding it point by point. The latter is
used when you have dynamic data: the chart will
be updated each time the function is called.
Although this call is fast (under some specific
conditions), it is always better to set the
points in one block when possible. Here is a
small code example that creates two series in
the chart and populates them with data: one
series is fully populated at initialization and
the other one is populated when the function OnDataReceived is
called (which only exists for the purpose of
this example). Them_pLineSeries, m_pPointsSeries and m_ChartCtrl are
member variables of the CMyClass class.
void CMyClass::Init()
{
.... m_pLineSeries = m_ChartCtrl.CreateLineSerie();
m_pPointsSeries = m_ChartCtrl.CreatePointsSerie();
double YValues[10];
for (inti=0;i<10;i++)
XValues[i] = YValues[i] = i;
m_pLineSerie->SetPoints(XValues,YValues,10);
}
void CMyClass::OnDataReceived(double X, double Y)
{
m_pPointsSeries->AddPoint(X, Y);
}
All series classes inherit from the same abstract base
class: CChartSerie.
This class handles general management which is
common to all series but doesn't have any
knowledge of points data. The concept of points
is introduced in the child class CChartSerieBase which
is a template class with the template parameter
being the data type to manipulate as points.
This is important because series might have to
handle different data types: for instance the
point series manipulates points with an X and an
Y value and the candlestick series manipulates
points with 5 values (open, close, high, low and
time values). All further series inherits fromCChartSerieBase and
provide the data type they manipulate. The CChartSerieBase class
already handles most of the data management and
delegate the rendering to the child classes
through pure virtual functions. Each series is
also assigned an Id when it is created. This Id
can be retrieved through theCChartSerie::GetSerieId() and
can be used to remove the series from the chart.
One important feature of the series is the one
controlling the ordering of the points: all the
points in the series will be reordered depending
on their values. By default, the points are
ordered based on their X values but you can
change this behavior by ordering them on their Y
values or not order them at all (in that case,
the series keeps the ordering in which the
points were added to the series). Ordering the
points can have an impact on performances: if
the points are ordered, the control is able to
retrieve the first and last visible points from
the full series and only draw the points in
between. On the other hand, you won't be able to
draw curves like an ellipse for instance. You
can change the ordering of the points by calling CChartSerieBase::SetSeriesOrdering.
The different series in the control are in
general self-explanatory. However, the bar
series requires some explanations.
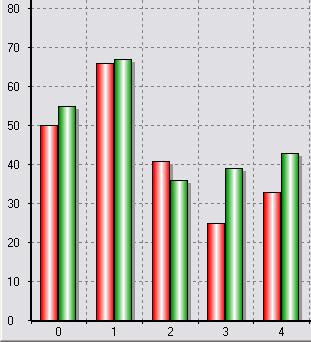
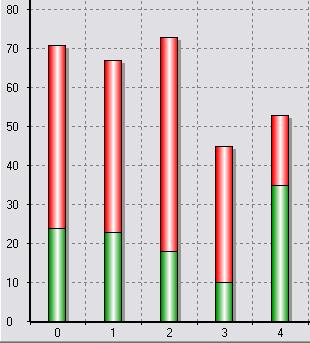
This series is a bit special in the sense that
if several of them are plotted together on the
same control, they will influence each other.
The purpose is to be able to plot multiple bar
series without them overlapping: they are drawn
next to each other. To do so, you need to
specify the group (a simple integer identifier)
to which each of them belongs. Series of the
same group are drawn next to each other (or on
top of each other for horizontal bars): see the
two figures for an example. Setting the group Id
is done through the SetGroupId function.
 |
 |
|
Bar series with the same group
Id
|
Bar series with different group
Id
|
You can also control the width of the space
which is left between all the bars by calling
the SetInterSpace
static function.
This sets the space in pixels for all the series
(so if more than two series are displayed, the
same space is used everywhere). Note that you
can set the width of the bar series individually
by calling SetBarWidth.
Once you have populated your series with data,
you can also add labels on specific points of
the series: one label is always attached to a
specific point. For now, only one type of label
is provided, a balloon label: a rounded
rectangle containing the text which is connected
to the point with a line. Of course, you can
also supply your own custom label if needed (see
section "Extending the functionalities").
There are two ways to supply the text's label:
either statically when creating the label or
dynamically by registering an object which will
provide the text when the label requests it. The
first method is the easiest but also a bit less
flexible. Here's a code snippet that shows how
to do so (assume that m_pSeries is
already created and populated with enough data):
void CMyClass::Init()
{
m_pSeries->CreateBalloonLabel(5,_T("This is a simple label"));
}
This call creates a label with the text "This is
a simple label" and attaches it to point with
index 5. The function returns a pointer to the
newly created label so that you can modify some
of its properties or store it for later use.
The second method is a bit more complex but
provides more flexibility: you can for instance
display point properties in the label (e.g. the
X value, the Y value, ...) in an easier way. For
this purpose, you have to create a class which
inherits from CChartLabelProvider<PointType> and
supply an instance of this class when you create
the label. This class is a template class with
the template parameter being the point type of
the series to which the label is attached. This
class is a simple interface for which you have
to override the TChartString
GetText(CChartSerieBase<PointType>* pSerie,
unsigned uPtIndex) method.
This function should return the text that has to
be displayed in the label. It receives a pointer
to the series and point index to which the label
is attached. Here is an example of such a label
provider class:
class CCustomLabelProvider : public CChartLabelProvider<SChartXYPoint>
{
public:
  TChartString GetText(CChartSerieBase<SChartXYPoint>* pSeries, unsigned uPtIndex)
  {
    TChartStringStream ssText;
    SChartXYPoint Point = pSeries->GetPoint(uPtIndex);
    ssText << _T("X value=")  << Point.X;
    return ssText.str();
  }
};
And this code snippet shows how to use it with a
label. Notice that the m_pSeries should
be a series which manipulate SChartXYPoint points
(points, line, surface or bar series). If that's
not the case, your code will give a compilation
error.
void CMyClass::Init()
{
m_pLabelProvider = new CCustomLabelProvider();
m_pSeries->CreateBalloonLabel(5, m_pLabelProvider);
}
The control doesn't take ownership of the
pointer, so it is your responsibility to delete
when it is not needed anymore. In the example
above, it would typically be deleted in the CMyClass destructor.
In the example above, you can of course reuse
the same label provider for all the labels you
want to add. This has another advantage: if you
want to change the format of the label at
runtime, you only have to add code in theCustomLabelProvider.
There is no need to walk over all existing
labels and change their text. Of course, in that
case a refresh of the control is needed because
the labels have to be redrawn. Note also the
usage of theTChartStringStream class,
which is a typedef provided by the control
(similar as TChartString).
It resolves to std::wstringstream when
UNICODE is defined and to std::stringstream when
UNICODE is not defined.
Axes are an important feature of the
chart
because they control how the different series
are displayed in the control. Up to four axes
can be used in the control: bottom, top, left
and right. Each series in the control must be
attached to one horizontal axis and one vertical
axis. Those axes are specified when you add the
series in the chart. The bottom and left axes
are the primary axes and the top and right axes
are the secondary axes (you will encounter this
in some functions of the control). You can
select between three types of axes: standard
axis, logarithmic axis and date/time axis. You
can of course select different types of axes at
the different axes position.
Once you've made your choice about which axes to
use at the different positions, you need to
create them before being able to add any data to
the control. For this, simply call CreateStandardAxis,CreateLogarithmicAxis or CreateDateTimeAxis by
specifying at which position the axis is
attached. If an axis was already created at that
position, the control will destroy it and
replace it by the new one. Here is a simple code
snippet that shows how to create a date/time at
the bottom and one standard axis on the left:
void CMyClass::Init()
{
  CChartStandardAxis* pBottomAxis =
	m_ChartCtrl.CreateStandardAxis(CChartCtrl::BottomAxis);
  CChartLogarithmicAxis* pLeftAxis =
	m_ChartCtrl.CreateLogarithmicAxis(CChartCtrl::LeftAxis);
}
Once you have created those axes, you can set
some properties on them. Most of the properties
are shared between all axis types (e.g.
automatic mode, min and max values, axis label,
...). An axis can be set in three "automatic"
modes: full automatic, screen automatic and
manual modes.
-
The full automatic mode calculates the axis
min and max values based on all series that
are attached to this axis (the minimum value
of all points of all series is used as
minimum for the axis and the maximum value
of all points of all series is used as
maximum for the axis).
-
The screen automatic mode calculates the
axis min and max values based on all visible points
of all series associated with this axis. For
instance, if the chart only display one
series which is attached to a manual bottom
axis and a screen automatic left axis, then
the left axis will adapt itself to the
points which are currently visible and not
take into account the points which are
outside the range of the bottom axis (in a
full automatic mode, the points outside the
bottom axis would be taken in
consideration). Warning: if both axes of a
series are in screen automatic mode, the
result is undefined.
-
In manual mode, the axis min and max values
are set by the user and are not calculated
by the control.
If you add data dynamically to the control,
using an automatic axis will refresh the control
if new points of data are outside the range of
the axis. Here is a code snippet (which
continues the previous one) showing a full
automatic axis (bottom axis) and a manual axis
(left axis, which is a logarithmic axis):
void CMyClass::Init()
{
pBottomAxis->SetAutomaticMode(CChartAxis::FullAutomatic);
pLeftAxis->SetAutomaticMode(CChartAxis::NotAutomatic);
pLeftAxis->SetMinMax(0.01,1000);
}
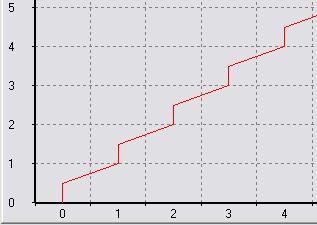
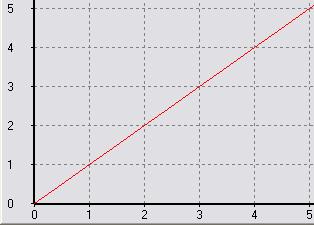
A common feature of all axes is also the
discrete mode, which is by default disabled.
When activated, this mode specifies that the
axis does not display a continuous range of
values but only discrete values, which are the
ones specified by the ticks on the axis. All
other values are simply not represented by the
axis. Trying to plot a value different than a
displayed tick value is not possible. Let's take
an example to make things clearer: suppose you
have a bottom standard axis with a tick interval
of 1.0 (so, the displayed ticks are 1, 2, 3 and
so on). Trying to plot a point with a X value of
0.5 will display the point at the same position
as if it had a value of 1.0. In fact, you can
consider that the region between two ticks is a
constant value. That's the reason why the tick
label is displayed in the middle of two ticks,
not on the tick itself.
Here is a small code snippet that shows the
impact of a discrete axis on how the series is
displayed. The two images under the code snippet
show the result of having the discrete mode
enabled (first image) or disabled (second
image).
void CMyClass::Init()
{
  CChartStandardAxis* pBottomAxis =
    m_ChartCtrl.CreateStandardAxis(CChartCtrl::BottomAxis);
  pBottomAxis->SetMinMax(0, 10);
  CChartStandardAxis* pLeftAxis =
    m_ChartCtrl.CreateStandardAxis(CChartCtrl::LeftAxis);
  pLeftAxis->SetMinMax(0, 10);

  pBottomAxis->SetTickIncrement(false, 1.0);
  pBottomAxis->SetDiscrete(true);
  CChartLineSerie* pSeries = m_ChartCtrl.CreateLineSerie();
  double XVal[20];
  double YVal[20];
  for (int i=0; i<20; i++)
  {
    XVal[i] = YVal[i] = i/2.0;
  }
  pSeries->SetPoints(XVal,YVal,20);
}
 |
 |
|
Discrete mode enabled
|
Discrete mode disabled
|
Date/time axes are a bit particular to use, so
here is some explanation about how to take
advantage of this feature. The important point
to understand about date/time axis is that they
work internally with COleDateTimeobjects.
The reason is simple: COleDateTime is
a wrapper class around the DATE type
which is simply a double.
As points in the chart are expressed as double values,
it fits nicely: there is no difference between
using standard points (non date/time) and
date/time points, which makes the usage of the
latter less complicated. All points are still
stored as double,
no matter if they are date/time or not.
Once you have created a date/time axis, you can
then populate data in the control. For that
purpose, nothing changed: you have to call
either void
AddPoint(double X, double Y) or void
SetPoints(double *X, double *Y, int Count) from
the CChartSerie class.
The CChartCtrl class
provides you with two staticfunctions
to let you convert from a COleDateTime to
a double and
vice-versa:
double DateToValue(const COleDateTime& Date)
COleDateTime ValueToDate(double Value)
If you have a date in another format (e.g. a time_t or
a SYSTEMTIME),
this is not a problem because theCOleDateTime object
can be constructed from different time formats
(check the MSDN documentation of theCOleDateTime class
to see from which format you can construct it).
Once you have populated your data, you can
configure the axis to display what you need.
Several functions related to date/time axis are
available:
void SetDateTimeIncrement(TimeInterval Interval, int Multiplier)
void SetDateTimeFormat(bool bAutomatic, const TChartString& strFormat)
void SetReferenceTick(COleDateTime referenceTick)
The first one lets you specify an interval
between two ticks displayed on the axis. The
interval between two ticks will respect the
correct time, meaning that if you specify a tick
increment of 1 month(Interval=CChartAxis::tiMonth
and Multiplier=1), then the space between
two ticks will be irregular (28, 30 or 31 days).
The second function lets you specify the format
of the tick label. The control automatically
formats the tick labels depending on the tick
interval but you can override it by calling this
function. Check the documentation of the COleDateTime::Format function
on MSDN for more information. Finally, theSetReferenceTick(COleDateTime
referenceTick) function
lets you specify a reference tick for the axis.
The reference tick is a date which is used as a
reference for drawing the ticks: a tick will
always be present at this date. This is useful
when you specified a multiplier different than 1
in the SetDateTimeIncrement function.
Suppose for instance that you specified a tick
increment of 3 months and you would like to have
a tick for February (and thus, for May, August,
...), then you can call this function to set
February 1st as
the reference tick. It is set to January 1st 2000
by default.
Here is a simple code snippet that creates a
date/time axis and shows the usage of the
different functions:
void CMyClass::Init()
{
COleDateTime minValue(2006,1,1,0,0,0);
COleDateTime maxValue(2007,12,31,0,0,0);
pBottomAxis->SetMinMax(CChartCtrl::DateToValue(minValue),
CChartCtrl::DateToValue(maxValue));
pBottomAxis->SetTickIncrement(false, CChartDateTimeAxis::tiMonth, 4);
pBottomAxis->SetTickLabelFormat(false, _T("%b %Y"));
}
The visual aspect of the control can be easily
adapted to different needs. The different parts
of the control (legend, title, background,...)
can be modified in order to get the aspect you
want. All interactions with these objects will
be made through the CChartCtrl class:
some will be created on demand (e.g. axes or
series) and some are created when the control is
created (legend, titles, ...). In general, you
will never create these objects yourself but
delegate that tucancode.net to the CChartCtrl class.
The only exception is when you want to use
custom axes or custom series (see "Extending the
functionalities" section). For instance, here is
a code snippet that sets a gradient background
and docks the legend at the bottom of the
control:
void CMyClass::Init()
{
m_ChartCtrl.EnableRefresh(false);
m_ChartCtrl.SetBackGradient(RGB(255,255,255),RGB(125,125,255),gtVertical);
m_ChartCtrl.GetLegend()->DockLegend(CChartLegend::dsDockBottom);
m_ChartCtrl.GetLegend()->SetHorizontalMode(true);
m_ChartCtrl.EnableRefresh(true);
}
Important: Since
version 1.4 of the control, every call to
modify a property on the control will cause
a complete refresh of the control (even
things like changing the font of some text
or the color of an object). To avoid that
the control is refreshed when it is not
necessary (e.g. when you change several
properties at the same time), you should
first disable the refresh, change the
properties and then re-enable the refresh,
as shown in the above code snippet.
Since version 1.5 of the control, support for
UNICODE has been introduced. All occurrences of std::stringobjects
have been replaced by TChartString objects,
which is simply a typedef which resolves to astd::string if
UNICODE is not enabled and resolves to std::wstring when
UNICODE is enabled.
Sometimes it is useful to be notified about
specific user actions and react appropriately to
them. For instance, if the user clicks on a
point, the program could display information
about the point being clicked. This is now
possible with the chart control and this section
will explain how to do it.
The principle is a bit different whether you
want to listen to general mouse events on the
chart itself (clicks on axes, legend, ...) or
whether you are interested in mouse events on a
specific series. Both cases are fairly easy to
implement.
You have to implement the CChartMouseListener interface,
override the methods in which you are interested
and register an instance of that class to the
chart control by callingCChartCtrl::RegisterMouseListener(CChartMouseListener
*pMouseListener). Different functions on
that interface are called depending on which
part of the control the mouse event occurred:
title, legend, axis or plot area. For all those
functions, two parameters are always passed: a MouseEvent,
which is an enumeration listing the type of
mouse event (mouse move, left click, ...) and a CPoint object
which contains the screen coordinates of the
point on which the event occurred. For some
functions, some additional parameters are passed
when needed. For instance, when an axis is
clicked, a pointer to this axis is passed to the
function.
Here is an implementation of the CChartMouseListener which
reacts on clicks on axes and displays a message
box:
class CCustomMouseListener : public CChartMouseListener
{
public:
  void OnMouseEventAxis(MouseEvent mouseEvent, CPoint point,
          CChartAxis* pAxisClicked)
  {
    if (mouseEvent == CChartMouseListener::LButtonDoubleClick)
    {
      MessageBox(_T("Axis clicked"), _T("Info"), MB_OK);
    }
  }
};
You then have to create an instance of this
class and register it with the control:
m_pMouseListener = new CCustomMouseListener();
m_ChartCtrl.RegisterMouseListener(m_pMouseListener);
Here also you will need to delete the pointer
yourself.
Listening to events on a series is very similar
as listening to general events, except that the
listener is an instance of CChartSeriesMouseListener which
is a template class with the template parameter
being the type of point of the series. This is
needed to avoid unnecessary casts when you want
to retrieve a specific value of the point. The
other difference is that you have to register
the listener on the series itself and not on the
chart control.
Here is an implementation of the CChartSeriesMouseListener which
reacts on clicks on the series and if the click
occurred on a point, it displays a message box
with the point's Y value:
class CCustomMouseListener : public CChartSeriesMouseListener<SChartXYPoint>
{
public:
  void OnMouseEventSeries(MouseEvent mouseEvent, CPoint point,
          CChartSerieBase<SChartXYPoint>* pSerie, unsigned uPointIndex)
  {
    if (mouseEvent == CChartMouseListener::LButtonDoubleClick &&
        uPointIndex != INVALID_POINT)
    {
      TChartStringStream ssText;
      SChartXYPoint Point = pSeries->GetPoint(uPointIndex);
      ssText << _T("Y value=")  << Point.Y;
      TChartString strText = ssText.str();
      MessageBox(NULL,strText.c_str(), _T("Info"), MB_OK);
    }
  }
};
Note that the function OnMouseEventSeries can
also be called when the user doesn't click on a
point. This is for instance the case for a line
series when the user clicks between two points
but still on the series. In that case,INVALID_POINT is
passed for the uPointIndex parameter.
You then have to create an instance of this
class and register it with the series:
m_pMouseListener = new CCustomMouseListener();
m_pSeries.RegisterMouseListener(m_pMouseListener);
Note that this will only work if the series
manipulates points of the type SChartXYPoint (points,
line, surface or bar series). If that is not the
case, your code will generate a compilation
error.
For performances reasons, the detection of
mouse move events on a series is disabled.
To enable it, take a look at the
CChartSerie::EnableMouseNotifications
function in the doxygen documentation.
You can also add cursors to the control. Two
types of cursors are supported: a "cross-hair"
cursor and a "dragline" cursor. The first one is
a simple cross displayed on the plotting area
which moves with the mouse and the second one is
a horizontal or vertical line associated with a
specific axis, which you can drag by clicking on
it and moving with the mouse. For each of the
cursors, you can register a listener to be
notified when the cursor has been moved. Here is
a snippet of code that creates a "cross-hair"
cursor associated with the bottom and left axis
and a "dragline" cursor associated with the
bottom axis:
CChartCrossHairCursor* pCrossHair =
m_ChartCtrl.CreateCrossHairCursor();
CChartDragLineCursor* pDragLine =
m_ChartCtrl.CreateDragLineCursor(CChartCtrl::BottomAxis);
m_ChartCtrl.ShowMouseCursor(false);
Note the call to CChartCtrl::ShowMouseCursor at
the end. By default, the mouse is always visible
but when you are using a cross-hair cursor, it
is sometimes nice to hide the mouse when it is
over the plotting area.
If you want to be notified when the cursor
position changed, you have to implement theCChartCursorListener interface,
create an instance of it and register it with
the cursor:
class CCustomCursorListener : public CChartCursorListener
{
public:
void OnCursorMoved(CChartCursor *pCursor, double xValue, double yValue)
{
TChartStringStream ssText;
ssText << _T("Cursor moved: xPos=") << xValue << _T(", yPos=") << yValue;
}
};
CCustomCursorListener* pCursorListener = new CCustomCursorListener;
pDragLine->RegisterListener(pCursorListener);
The OnCursorMoved function
receives a X and Y value but for a dragline
cursor, only one of these values is used: if the
cursor is associated with an horizontal axis,
then the X value is used, otherwise the Y value
is used.
In version 1.1 of the control, zoom and pan
features have been added to the control. The
zoom is controlled with the left mouse button,
and the pan is controlled with the right mouse
button. To zoom a specific part of the chart,
simply left-click on the chart (this will be the
upper-left corner of the zoomed rectangle) and
drag to thebottom-right.
A rectangle will appear. As soon as you release
the mouse button, the four axes will
automatically adjust themselves to the region
you have selected. The zoom is enabled by
default but you can disable it by calling CChartCtrl::SetZoomEnabled(bool
bEnabled). You can also specify a zoom
limit for each axis by calling CChartAxis::SetZoomLimit(double
dLimit). This specifies the minimum range
of the axis while zooming. Default is 0.001.
To pan the control, right-click somewhere on the
control and move the mouse. The point under the
mouse will 'follow' the movement of the mouse
(in fact, the axis min and max will change). The
pan is enabled by default but you can disable it
by calling CChartCtrl::SetPanEnabled(bool
bEnabled).
If you left-click on the chart (like for
starting a zoom) but if you move to the top-left corner
instead, all the modifications done with the
zoom and pan features will be cancelled (the
control will be in the state it was before the
manipulations with the pan and zoom). Finally,
there is also a way to disable to pan and zoom
feature for a specific axis by calling CChartAxis::SetPanZoomEnabled(bool
bEnabled).
The line and point series allow you to plot data
at a high rate. This is typically done when you
want to plot data coming from an external device
for example (e.g. a sensor). This is possible
because, when you add a point to such a series,
the control won't be refreshed totally, only the
last point (or last line section) will be drawn,
which is quite efficient. However, you have to
take into consideration several points if you
want the control to plot data fast enough.
One important thing is that the use of automatic
axes will probably decrease a lot the
performances. This is due to the fact that if a
point is plotted outside the range of the axis,
the axis range will be automatically adjusted,
which means that the control will be totally
refreshed. So, if you are using an automatic
bottom axis and have a 'scroll' trace, each new
point will be outside the current range of the
axis and a refresh of the control will occur for
every points. A better way to handle that would
be to use a fixed axis and to increase manually
the range of the axis each second (or at a
reasonable rate).
Another important point is that you should
never call RefreshCtrl after
having added a new point to a series. This will
of course refresh completely the control which
should be avoided. Finally, if you need to apply
several modifications or add several points to
the control at the same time, you should wrap
those calls betweenEnableRefresh(false) and EnableRefresh(true) (see
the "Customizing the Appearance" section).
In some specific cases, you will need to extend
the control with new features, for instance a
new series type. Currently, there are four
components that you can customize: series, axes,
point labels and cursors.
To provide new axes, new labels or new cursors,
you simply have to inherit from the base class (CChartAxis,CChartLabel or CChartCursor)
and implement the required virtual functions.
Once this is done, you can attach your new
object by calling the custom version of the
different functions (CChartCtrl::AttachCustomAxis, CChartCtrl::AttachCustomLabel orCChartCtrl::AttachCustomCursor).
The CChartLabel class
is a template class. This subject is a bit to
broad to go into much details but the easiest
way is to look at the different existing
classes.
If you want to provide new series, this is a bit
different: you first have to think about the
type of points you want to manipulate in your
series. If you simply have to manipulate points
with an X and a Y value, then you can inherit
from CChartXYSerie which
provides already a lot of functionalities to
manipulate such points. You then have to
implement the required virtual functions. Take a
look at the following series: CChartLineSerie,CChartPointSerie, CChartSurfaceSerie and CChartBarSerie for
concrete examples.
If your series manipulate other kind of points,
then you first have to create a structure for
the point which contains the following methods: double
GetX(), double
GetXMin(), double
GetXMax(), double
GetY(),double
GetYMin) and double
GetYMax(). Once this is done, you have to
inherit from CChartSerieBaseand
supply this point as a template parameter. You
then have to provide the required virtual
functions. Take a look at the following series
for concrete examples: CChartCandlestickSerie and CChartGanttSerie.
In version 2.0, a refactoring was done on the
control which resulted in changes in the API.
The major visible change is that each axis type
has now its separate class (CChartStandardAxis, CChartDateTimeAxis andCChartLogarithmicAxis).
This also means that no axis is created by
default and you must create
them yourself before adding series to the chart
(otherwise the code will assert). This is
covered in the "Manipulating the Axes" section.
Another change is the way to add series to the
chart: the AddSerie has
been removed in the CChartCtrl class
and has been replaced by helper functions to
create specific series types (CreateLineSerie,CreatePointsSerie,
...). Those functions return the exact series
type so casting is not necessary anymore. This
is covered more in details in the "Manipulating
Series" section.
The major change in release 3.0.0 is that the
series base class has now been made a template
class with the template parameter being the type
of point the series is manipulating. If you
didn't extend the control by supplying new
series types, this won't make a difference in
your code. If you supplied a new series type,
your class has to inherit from CCharSerieBase and
supply the type of point it is manipulating. If
your series use points with X and Y values only,
you can simply inherit from CChartXYSerie.
Take a look at the existing series for more
examples.
Another small modification is that the label
providers are now also template classes (for the
same reason). And listening to mouse events on a
series is now split from mouse events on the
chart itself. Those two points are well
explained in the Adding
Labels on Points section
and Being
Notified about Mouse Events section.
Finally, the CChartAxis::SetAutomatic method
has been marked deprecated, you should use theCChartAxis::SetAutomaticMode instead
(an additional automatic mode has been
introduced).
This section is simply two code snippets that
show how the control can be used. The first
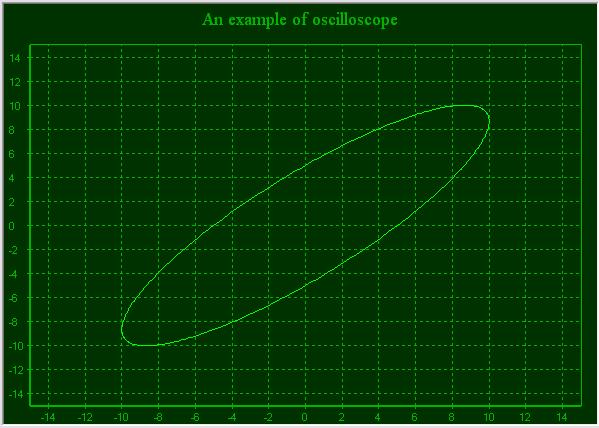
snippet reproduces the image of the oscilloscope
example (see the top of this article) and the
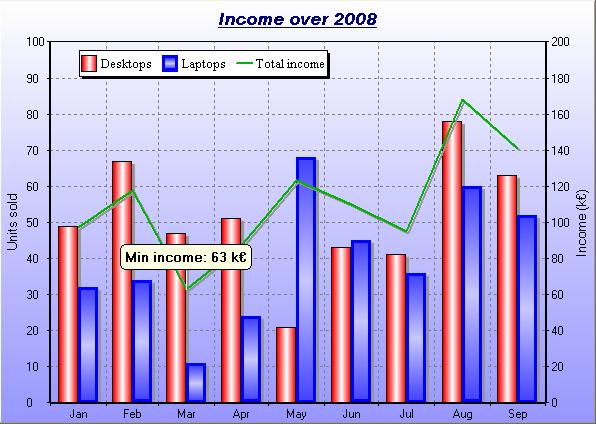
second example reproduces the "Income over 2008"
image. The code is documented so it shouldn't be
too difficult to understand.
Oscilloscope example:
m_ChartCtrl.EnableRefresh(false);
CChartStandardAxis* pBottomAxis =
m_ChartCtrl.CreateStandardAxis(CChartCtrl::BottomAxis);
CChartStandardAxis* pLeftAxis =
m_ChartCtrl.CreateStandardAxis(CChartCtrl::LeftAxis);
pBottomAxis->SetMinMax(-15,15);
pLeftAxis->SetMinMax(-15,15);
CChartLineSerie* pLineSeries = m_ChartCtrl.CreateLineSerie();
pLineSeries->SetSeriesOrdering(poNoOrdering);
for (int i=0;i<361;i++)
{
double X = 10 * sin(i/360.0 * 2 * 3.141592);
double Y = 10 * cos( (i-60)/360.0 * 2 * 3.141592);
pLineSeries->AddPoint(X,Y);
}
COLORREF BackColor = RGB(0,50,0);
COLORREF GridColor = RGB(0,180,0);
COLORREF TextColor = RGB(0,180,0);
COLORREF SerieColor = RGB(0,255,0);
m_ChartCtrl.SetEdgeType(EDGE_SUNKEN);
m_ChartCtrl.SetBorderColor(TextColor);
m_ChartCtrl.SetBackColor(BackColor);
m_ChartCtrl.GetBottomAxis()->SetAxisColor(TextColor);
m_ChartCtrl.GetBottomAxis()->SetTextColor(TextColor);
m_ChartCtrl.GetBottomAxis()->GetGrid()->SetColor(GridColor);
m_ChartCtrl.GetLeftAxis()->SetAxisColor(TextColor);
m_ChartCtrl.GetLeftAxis()->SetTextColor(TextColor);
m_ChartCtrl.GetLeftAxis()->GetGrid()->SetColor(GridColor);
m_ChartCtrl.GetTitle()->SetColor(TextColor);
m_ChartCtrl.GetTitle()->SetFont(140,_T("Times New Roman"));
m_ChartCtrl.GetTitle()->AddString(_T("An example of oscilloscope"));
pLineSeries->SetColor(SerieColor);
m_ChartCtrl.EnableRefresh(true);
"Income over 2008" example:
srand((unsigned int)time(NULL));
m_ChartCtrl.EnableRefresh(false);
COleDateTime Min(2008,1,1,0,0,0);
COleDateTime Max(2008,10,1,0,0,0);
CChartDateTimeAxis* pBottomAxis =
m_ChartCtrl.CreateDateTimeAxis(CChartCtrl::BottomAxis);
pBottomAxis->SetMinMax(Min,Max);
pBottomAxis->SetDiscrete(true);
pBottomAxis->SetTickIncrement(false,CChartDateTimeAxis::tiMonth,1);
pBottomAxis->SetTickLabelFormat(false,_T("%b"));
CChartStandardAxis* pLeftAxis =
m_ChartCtrl.CreateStandardAxis(CChartCtrl::LeftAxis);
pLeftAxis->SetMinMax(0,100);
pLeftAxis->GetLabel()->SetText(_T("Units sold"));
CChartStandardAxis* pRightAxis =
m_ChartCtrl.CreateStandardAxis(CChartCtrl::RightAxis);
pRightAxis->SetVisible(true);
pRightAxis->GetLabel()->SetText(_T("Income (kEuros)"));
pRightAxis->SetMinMax(0,200);
m_ChartCtrl.GetLegend()->SetVisible(true);
m_ChartCtrl.GetLegend()->SetHorizontalMode(true);
m_ChartCtrl.GetLegend()->UndockLegend(80,50);
m_ChartCtrl.GetTitle()->AddString(_T("Income over 2008"));
CChartFont titleFont;
titleFont.SetFont(_T("Arial Black"),120,true,false,true);
m_ChartCtrl.GetTitle()->SetFont(titleFont);
m_ChartCtrl.GetTitle()->SetColor(RGB(0,0,128));
m_ChartCtrl.SetBackGradient(RGB(255,255,255),RGB(150,150,255),gtVertical);
CChartBarSerie* pBarSeries1 = m_ChartCtrl.CreateBarSerie();
CChartBarSerie* pBarSeries2 = m_ChartCtrl.CreateBarSerie();
CChartLineSerie* pLineSeries = m_ChartCtrl.CreateLineSerie(false,true);
int lowIndex = -1;
int lowVal = 999;
for (int i=0;i<9;i++)
{
COleDateTime TimeVal(2008,i+1,1,0,0,0);
int DesktopVal = 20 + rand()%(100-30);
pBarSeries1->AddPoint(TimeVal,DesktopVal);
int LaptopVal = 10 + rand()%(80-20);
pBarSeries2->AddPoint(TimeVal,LaptopVal);
int Income = DesktopVal + LaptopVal*1.5;
if (Income < lowVal)
{
lowVal = Income;
lowIndex = i;
}
pLineSeries->AddPoint(TimeVal,Income);
}
pBarSeries1->SetColor(RGB(255,0,0));
pBarSeries1->SetName(_T("Desktops"));
pBarSeries2->SetColor(RGB(68,68,255));
pBarSeries2->SetGradient(RGB(200,200,255),gtVerticalDouble);
pBarSeries2->SetName(_T("Laptops"));
pBarSeries2->SetBorderColor(RGB(0,0,255));
pBarSeries2->SetBorderWidth(3);
pLineSeries->SetColor(RGB(0,180,0));
pLineSeries->SetName(_T("Total income"));
pLineSeries->SetWidth(2);
pLineSeries->EnableShadow(true);
TChartStringStream labelStream;
labelStream << _T("Min income: ") << lowVal;
CChartBalloonLabel<SChartXYPoint>* pLabel =
pLineSeries->CreateBalloonLabel(lowIndex, labelStream.str() + _T(" kEuros"));
CChartFont labelFont;
labelFont.SetFont(_T("Microsoft Sans Serif"),100,false,true,false);
pLabel->SetFont(labelFont);
m_ChartCtrl.EnableRefresh(true);
Quite a lot of work is involved in the
development of this control and, as any other
software project, it might still contain bugs or
errors in the documentation. If you encounter
such a problem, please let me know (even if you
fixed it yourself) so that I can fix the issue
as soon as possible. Other users of the control
will thank you for that. The same if you
encounter errors in the documentation or typos
in the article.
I'm also more or less constantly working on this
control to add new features. If you have some
requirement for a nice feature that could be
useful for others, please let me know and I'll
add it to my wishlist. However, as I'm working
on this control in my spare time, my time is
rather limited.
Finally, if you liked this control, do not
hesitate to drop me a word in the discussion
forum or to rate the article, this is much
appreciated. Thank you.
ChartCtrl_source
News:
1 UCanCode Advance E-XD++
CAD Drawing and Printing Solution


