A well
designed Real
Time plot must face several
problems:
Memory
usage.
A
Real Time plot
contains no data at the beginning, but
will be feed with data typically once
pr. second. It must be able to
dynamically re-size its data storage and
monitor its own memory usage. I will
like to set up a limitation for each
plot
chart
and a limitation for all
plots
to prevent my application from running
out of memory. Circular lists should
since its a fast way of 'rotating' oldes
values out of the array. We can not use
standard new and delete, they are far to
slow, but will use
malloc (realloc).
Data
Collecting.
The
plot
must be able to collect data from high
speed samling processes and update
itself at a slower frequence. I will
typically insert data to the
plot
10 to 100 timer a second, but the
plot
should only update its display once a
second to reduce the CPU stress to a
minimum. I have shoosen to let the
caller control this. The best way is to
let a thread enter data as they are
collected, and use a Timer to update the
plot
once pr. second. Updating the plot
faster is possible, but this will limit
the number of
plots and stress the CPU.
Complex
Line Types.
Windows
supports dotted
lines, but if you
draw
a dotted line
with to many points it become a solid
line. A solution to this is to collect
line points in an array and use the
PolyLine to
draw the line. This preserves
the line styles and is actually also a
far faster
drawing method.
Auto
Scrolling.
The
plot
must be able to automatically scroll
through time as new data comes in.
Oldest data will be pushed out at the
left side.
Individual Y Axis.
I would
like to use both Y axis to display the
range of a gauge. And I will like to
select whitch Y axis to use for each
serie of data.
Multiple Legends.
The
plot
should be able to display multiple
legends indepent of each other and the
data series. I will typically like to
display pressure and temperature from 3
gauges. One legend should display the
line styles (solid for pressure and
dotted
for temperature), while the other
displays the color codes for the gauges.
Both a primary and a secondary legend
are prepared, but the current
implementation will only use the primary
one.
Plot Data.
Plot
data should only be limited by memory or
the limitation I have selected for my
application. I will typically like to
display
lines
containing 10000 points or more. This is
implemented as a programmable option.
Data
Series.
I will like
to display
a large number of series at the same
time, but I accept a upper limitation of
50 data serier pr.
plot to prevent the use of
dynamic tables or linked list. This
limitation can easily be increased.
Performance.
The
plot
must be fast, very fast! I would
typically like to display 20++
plots
at the same time on an Pentium 150Mhz
running Windows 95 or Windows NT. This
is partly achieved by the use of
PolyLine, one PolyLine call is after all
far faster than 1000 LineTo. Another
issue is collecting data for entire
seconds to avoid updating the display
several times pr. second. Malloc/realloc
will be used for memory allocation since
this is significantly faster than
new/delete. The last trick is filtering.
We will as we build the PolyLine array
remove points on top of each other, this
should reduce any line down to a max of
1000 points to be displayed.
The demo
program has been tested on Windows NT
(200Mhz) with more than 100
plots
active simultaneously
Multi
Threading.
The
plot
must support a multi threaded system. It
should not require multiple threads
since Windows 95/NT only is capable of
running 100++ threads at the same time.
But it must be possible to enter data
into the plot
from one thread and update it from
another thread (typically
CView::OnTimer). The best way is to
accept that an user holding down a mouse
will 'pause' the
plot, rather than using
threads for update. A RT application
will most likely need the threads for
far more important things. But this is
up to the user to decide.
On-Line
Zooming.
I will like
to use the mouse to select a range and
zoom in on this. This must be done
without 'visual noice'. The
plot
typically have to preserve the select
rectangle, update itself and redisplay
the select rect. The grid lines must
also change as I zoom in/out. Zooming
are prepared, but not implemented in the
current release.
Annotations.
I will like
to select individual data points with my
mouse. Typically with a cross or a
vertical line as the mouse marker. This
is also part of the design, but is not
currently implemented.
Flicker
Free.
The
plot
should be flicker free and scroll
smoothly. The actual implementation is a
copy send me by one of the users. I have
ssuccessfully used CreateCompatibleDC
before, but was experiencing problems
with this on the NT until a user learned
me the trick about overriding
OnEreaseBk.
The
current version was written as a
case-studie to demonstrate and prove
that this kind of performance was
possible. It is a good demonstration of
several important techniques used in
Real Time plots.
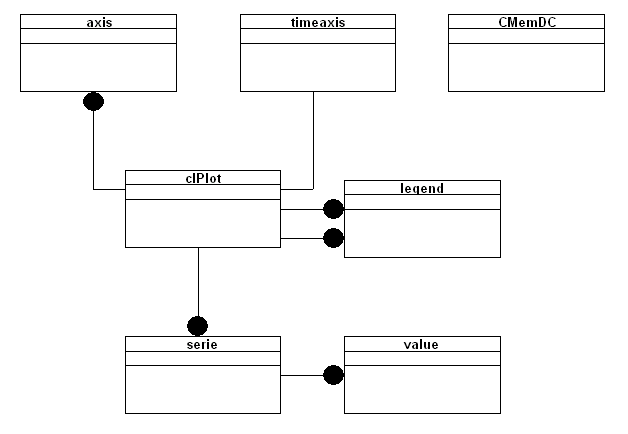
Some
work on the X axis must be done.

axis
holds information for left and right Y
axis.
timeaxis holds information for
X-timeaxis.
legend holds information of each
line in the legend.
serie
holds information for each data serie
(color, linestyle and data-array).
value
is the data array.
clPlot is the CWnd derivated
component and contains most of the
plot
source. The prefix 'cl' stands for Case
Laboratories and has been used to avoid
a possible naming conflict with all
shose who uses the 'standard C' prefix.
Download
Source 179K


