1
PGL is a
library
that encapsulates plot capabilities in a MFC
project for VC++
6 and VC++ .NET
2003. It is designed to be able to
easily plot data generated in a project
without the need of any external software.
In fact, with CView and
CDialog derived classes, you can have
your app display
chart in 5 minutes.
The aim of PGL is not to
have a user-friendly environment but rather
being able to generate any plot from the
source code.
PGL was originally using
OpenGL to raster graphics but
now it uses GDI+ (so you need
to install Microsoft SDK to compile
PGL).
2
- Add the following in your StdAfx.h
file :
 Collapse
 |
Copy Code
#include "PGL.h"
- Since
PGL is using
GDI+, you must initialize
it :
- Add the following variable to
your
CWinApp derived
class
Collapse |
Copy Code
ULONG_PTR m_ulGdiplusToken;
- Add the following to the
CWinApp::OnInitInstance function to
initialize
GDI+
Collapse |
Copy Code
Gdiplus::GdiplusStartupInput gdiplusStartupInput;
Gdiplus::GdiplusStartup(&m_ulGdiplusToken, &gdiplusStartupInput,
NULL);
- Add the following to the
CWinApp::OnExitInstance function to
clean up
GDI+.
Collapse |
Copy Code
Gdiplus::GdiplusShutdown(m_ulGdiplusToken);
Your project should work fine now.
Examples
All these examples are accessible in the
source. See the example menu of TestPGL.
Example 1 : Drawing a simple line
This is a first explanatory example. We
suppose that the points (x,y) of the line
have been generated and are stored in two
array
pX,pY of size
nPoints ( note that you can also pass
data as
std::vector<double> to
PGL).
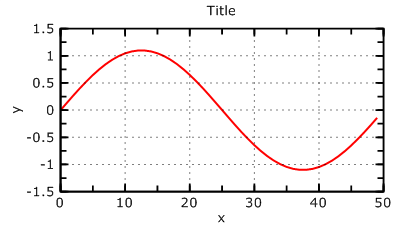
Here's the code I used to generate the
data: a simple sinusoid. Note that the y are
in [-1.1, 1.1] but PGL will
handle axe labelling the have nice units.
Collapse |
Copy Code
int nPoints = 50;
double* pX=new double[nPoints];
double* pY=new double[nPoints];
for (UINT i=0;i< nPoints;i++)
{
pX[i]=i;
pY[i]=sin(i/(double)nPoints*2*3.14)*1.1;
}
- First, create a graph object:
Collapse |
Copy Code
CPGLGraph* pGraph = new CPGLGraph;
Note that you can check all PGL
object with ASSERT_VALID
since they all inherit from
CObject.
- Create a 2D line:
Collapse |
Copy Code
CPGLLine2D* pLine = new CPGLLine2D;
- Attach the data to the line.
PGL will handle the memory
afterwards. That is, it will delete the
pointers of data at the object
destruction. This means pX,pY
MUST have been allocated on the heap !
Collapse |
Copy Code
pLine->SetDatas( nPoints ,
pX , pY );
- (Optional)Change some properties of
the line: pLine->SetLineWidth(2);
- Add the line to the graph (note that
an object can be added to only one
graph):
Collapse |
Copy Code
pGraph->AddObject(pLine);
- Make
PGL scale the plot
(automatically)
Collapse |
Copy Code
pGraph->ZoomAll();
- Create a dialog box and display the
plot:
Collapse |
Copy Code
CPGLGraphBitDlg graphdlg(this, pGraph);
graphdlg.DoModal();
You should have the same as the image above.
Note that this image (PNG) has been
generated by
PGL.
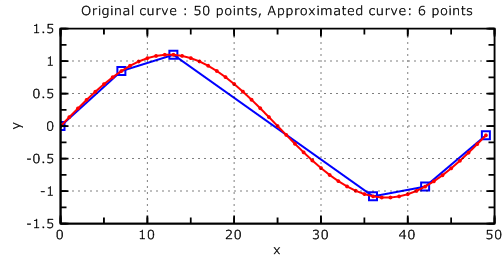
Example 2 : Adding a line with level of
detail control
You may have to plot line with thousands of
points. This can become very heavy and
especially if you export it to EPS, the
files can become very large. To overcome
this problem, you can use a line with LOD
included in
PGL.
In this examples, we approximate the
previous line. Starting from the previous
example,
- Change the line of code
Collapse |
Copy Code
CPGLLine2D* pLine = new CPGLLine2D;
to
Collapse |
Copy Code
CPGLLine2DLOD* pLine = new CPGLLine2DLOD;
- Change tolerance of level of detail
Collapse |
Copy Code
pLine->SetTol(0.05);
- Shrink the number of points by a
desired compression ratio (here to 10%
with 2% threshold)
Collapse |
Copy Code
pLine->ShrinkNorm(0.1,0.02);
On the figure above, you can see the
original line and the approximated one. You
can gain a serious amount of points using
this technique!
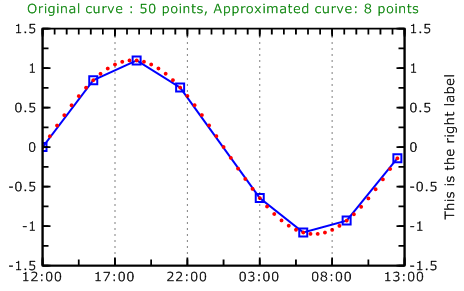
Example 3: Customizing axis, labeling,
etc...
As you can see in the previous image, all
the parameters of the objects are changeable
in the code. In this example, we shall
- change the title text,
- turn off horizontal grid,
- show right label,
- change number of ticks on the top
axis,
- switch to time labelling for the
x-axis,
- and more...
We start from the second example and add the
following line of code before calling
ZoomAll().
- Get a pointer the axis object (there
a huge mistake of English but in French
it's ok :)(axe -> axis))
Collapse |
Copy Code
CPGLAxe2D* pAxis = pGraph->GetAxe();
- Change the title text and color
Collapse |
Copy Code
pAxis->SetTitle(str);
or
Collapse |
Copy Code
pAxis->GetTitle()->SetString(str);
Collapse |
Copy Code
pAxis->GetTitle()->SetColor(0 ,0.5f ,
0 );
- Turn off vertical grid, (vertical ->
0, horizontal -> 1)
Collapse |
Copy Code
pAxis->SetShowGrid(1,FALSE);
- Show and change right label,
Collapse |
Copy Code
pAxis->GetRightLabel()->Show(TRUE);
pAxis->GetRightLabel()->SetString("This is the right label");
- Show right numbering
Collapse |
Copy Code
pAxis->GetRightNumber()->Show();
- Changing number of ticks on the top
axis,
Collapse |
Copy Code
pAxis->SetTopSecondTicksNb(5);
- Switch to time labelling the x-axis,
Collapse |
Copy Code
pAxis->SetTimeLabel(TRUE);
pAxis->SetTimeLabelFormat(COleDateTime::GetCurrentTime()
,
COleDateTimeSpan(0,0,30,0) ,
"%H:%M:%S" );
I've also disabled the line drawing and set
the tolerance to 0.025 for the LOD line. Of
course, you can do much more. This is just
an example.
Example 4: Sub-plotting !
What about putting multiple plots on a
figure: that's possible in
PGL
in many ways. In fact you can add plots to
plots, and so on.
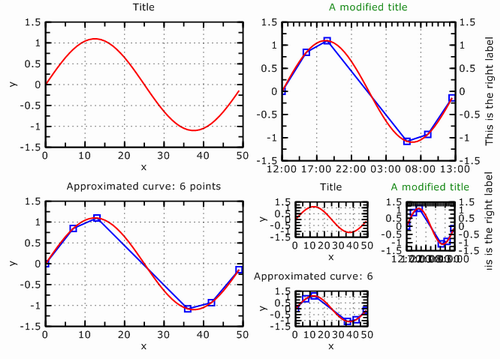
The class
CPGLGraph is
inherited from a generic plot class :
CPGLRegion. You can either
- use the function
Divide(m,n)
to divide the region in an array of m
rows and n columns (Note that this
method erase all object in the region).
After that, you can access the elements
with GetChilds(i) (the
regions are created row by row). You can
get the number of children with
GetNChilds():
Collapse |
Copy Code
CPGLRegion* pRegion;
pRegion->Divide(m,n);
CPGLRegion* pChildRegion = pRegion->GetChild(2*n+1);
- Create an add directly a region
using
AddRegion. To use
this method you must
SetNormBBox(...) to set the
bounding box (in Normalized coordinates
with respect to the parent region)
Collapse |
Copy Code
CPGLRegion* pChildRegion = pRegion->AddRegion();
pChildRegion->SetNormBBox(0.1 , 0.2 ,
0.7 , 0.8 );
Of course, you can divide child regions and
so on.
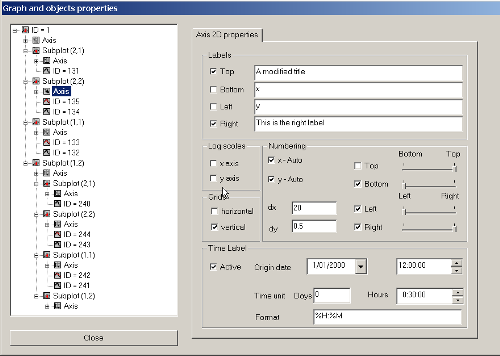
Example 5: Changing properties of
objects at run time
You can explore the object hierarchy by
right clicking the view or dialog.
Unfortunately, serialization is not working
yet. So it is lost work...
3
The documentation is generated with Doxygen
and Doxygen studio. See Plot
Graphic Library.dow
file. Otherwize, it is shipped with the
Microsoft Installer.
 High-speed Charting Control, Real Time Chart,
Data Visualization, C# Source Code
High-speed Charting Control, Real Time Chart,
Data Visualization, C# Source Code